
Quantifying the Impacts of Foodborne Illnesses
- by Sandra Hoffmann
- 9/8/2015
The U.S. Centers for Disease Control and Prevention (CDC) estimates that each year approximately 48 million people in the United States are sickened by a foodborne illness. Most of these illnesses are not reported to health authorities and the specific cause is not known. In most cases, foodborne illnesses are short lived and treated at home. Other times, medical care is sought, but no tests are run or the illness is not recognized as foodborne. In only 20 percent of U.S. foodborne illness cases (9.4 million illnesses) can a specific pathogen be identified as the cause, presumably for the more serious illnesses.
Government agencies, food industry personnel, and others expend considerable resources attempting to prevent foodborne illnesses. Those in the food safety community increasingly look to information on the cause and impact of foodborne illnesses to help focus their efforts. Knowing the economic burden of foodborne illness—the impact on the welfare of all individuals in a society—can help public health officials and food industry better marshall food safety resources.
Estimates of the economic burden of specific foodborne pathogens provide a means of comparing economic burden across pathogens that cause illnesses with very different symptoms and outcomes. ERS was an early leader in developing and refining estimates of the economic burden of foodborne illnesses since the late 1980s. ERS’s most recent economic burden estimates include the cost of medical treatment, the value of lost wages, and societal willingness to eliminate the risk of deaths caused by the pathogen. Other components of economic burden—such as time spent caring for sick family members, the value of lost leisure or education time, and the value of avoiding the pain and suffering associated with these illnesses—are not included because of the difficulty of valuing these components.
ERS has analyzed the economic burden of the 15 pathogens responsible for 95 percent of the 9.4 million episodes of foodborne illness for which a pathogen cause can be identified. ERS estimates that these 15 pathogens impose $15.5 billion in economic burden annually. Just five pathogens—Salmonella (all non-typhoidal species), Toxoplasma gondii, Listeria monocytogenes, Norovirus, and Campylobacter—account for 90 percent of this economic burden.
| Pathogen | Cases1 | Hospitalizations1 | Deaths1 | Economic burden2 |
|---|---|---|---|---|
| Campylobacter, all species | 845,024 | 8,463 | 76 | 1,608.4 |
| Clostridium perfringens | 965,958 | 438 | 26 | 342.7 |
| Cryptosporidium, all species | 57,616 | 210 | 4 | 51.8 |
| Cyclospora cayetanensis | 11,407 | 11 | 0 | 2.3 |
| Listeria monocytogenes | 1,591 | 1,455 | 255 | 2,834.4 |
| Norovirus | 5,461,731 | 14,663 | 149 | 2,255.8 |
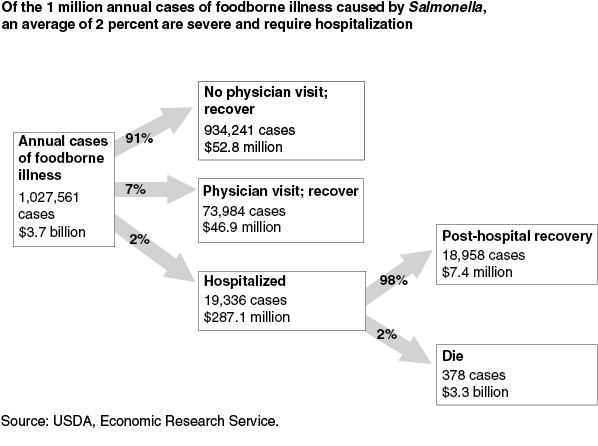
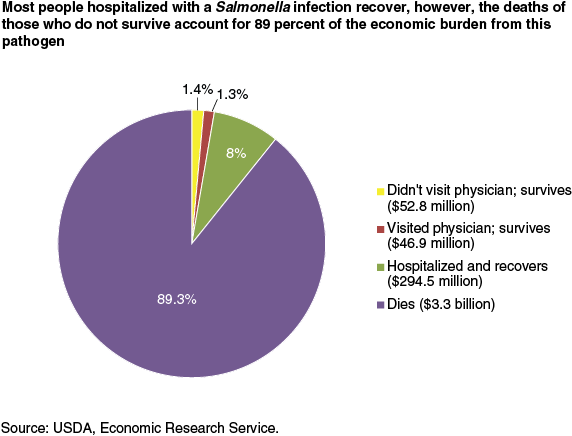
| Salmonella, all non-typhoidal species | 1,027,561 | 19,339 | 378 | 3,666.6 |
| Shigella, all species | 131,254 | 1,456 | 10 | 138.0 |
| STEC non-O157:H7 | 112,752 | 271 | 0 | 27.4 |
| STEC O157:H7 | 63,153 | 2,138 | 20 | 271.4 |
| Toxoplasma gondii | 86,686 | 4,428 | 327 | 3,304.0 |
| Vibrio, other non-cholera species | 17,564 | 83 | 8 | 72.8 |
| Vibrio parahaemolyticus | 34,664 | 100 | 4 | 40.7 |
| Vibrio vulnificus | 96 | 93 | 36 | 319.9 |
| Yersinia enterocolitica | 97,656 | 533 | 29 | 278.1 |
| 1Mean incidence number 2Millions of dollars - $2013 Note: Economic burden is estimated as cost of treatment + productivity loss of working adults + willingness to pay to prevent premature deaths. Source: USDA, Economic Research Service. |
||||
A foodborne pathogen’s economic burden is determined by both the number and severity of illnesses it causes. For example, Norovirus is the most common U.S. foodborne illness, but one from which 90 percent of infected people recover without seeking medical care. In contrast, Listeria monocytogenes sickens a relatively small number of Americans each year, but almost 20 percent of those infected die.

ERS’s new report, Economic Burden of Major Foodborne Illnesses Acquired in the United States, provides materials that could be used by regulatory agencies to conduct cost/benefit analyses, by public health officials to develop food safety educational materials, and by others interested in foodborne illnesses. Pie charts and disease outcome trees visually display the economic burden of the 15 major foodborne pathogens—broken out by health outcome—and highlight the role that severity and long-term consequences play in the burden that each pathogen imposes on society. In addition to estimates of economic burden, the report includes a description of the illness caused by each pathogen and a discussion of the pathogen’s relative importance in terms of traditional public health measures and economic burden.
This article is drawn from:
- Hoffmann, S., Maculloch, B. & Batz, M. (2015). Economic Burden of Major Foodborne Illnesses Acquired in the United States. U.S. Department of Agriculture, Economic Research Service. EIB-140.
You may also like:
- Cost Estimates of Foodborne Illnesses. (n.d.). U.S. Department of Agriculture, Economic Research Service.