
Following Dietary Guidance Need Not Cost More—But Many Americans Would Need To Re-Allocate Their Food Budgets
- by Andrea Carlson, Diansheng Dong, Hayden Stewart and Elizabeth Frazão
- 9/8/2015
Highlights
- Most Americans across all income levels consume poor diets.
- Behavior changes, such as preparing food at home instead of eating out, are associated with improvements in diet quality.
- To realize the much larger improvements in diet quality required to meet the Dietary Guidelines for Americans, many Americans would need to reallocate their food budgets, spending a larger share on fruits and vegetables and a lower share on protein foods and foods high in solid fats, added sugars, and sodium.
Every 5 years, the U.S. Departments of Agriculture and Health and Human Services update The Dietary Guidelines for Americans, with the latest release scheduled for the end of 2015. These guidelines discuss the components of a healthy diet, focusing on the types and amounts of food to feature in a healthy diet, and which foods to cut back on. The Dietary Guidelines are used by consumers, nutrition educators, and policymakers. For example, the Dietary Guidelines form the basis for the Federal Government’s MyPlate dietary advice and the nutrition standards for USDA’s National School Lunch and School Breakfast Programs.
The average American does a poor job of following Federal dietary guidance. Many Americans get too many calories from refined grains, solid fats, and added sugars, and do not eat enough fruits, vegetables, and whole grains. Nutrition guidance recommends that a 2,000-calorie diet include 2 cups of fruit, 2.5 cups of vegetables, and a minimum of 3 ounces of whole grains. Instead, the National Health and Nutrition Examination Survey (NHANES) finds American adults consuming about 1 cup of fruit, 1.6 cups of vegetables, and 0.8 ounces of whole grains each day. Cost has been raised as a possible barrier to a healthy diet. However, both healthy and less-healthy diets are available at low and high cost, suggesting that cost is not the only, or even the most important, barrier.
Most U.S. Diets Need Improving
Food cost is only one of many factors that consumers consider when making decisions about the foods they eat. Taste, familiarity with specific foods, how much time a consumer has to prepare a food or a meal, the skills required to prepare the food, and how hungry a consumer feels all play a role.
A consumer’s preference for eating a healthy diet also matters. Consumers who value health will seek out healthy foods that fit their budget and time constraints. However, consumers who do not put a high priority on eating healthy and believe that a healthier diet costs more than their current diet, may choose to continue with their current diet rather than spend the time and effort in seeking out healthy foods they can afford.
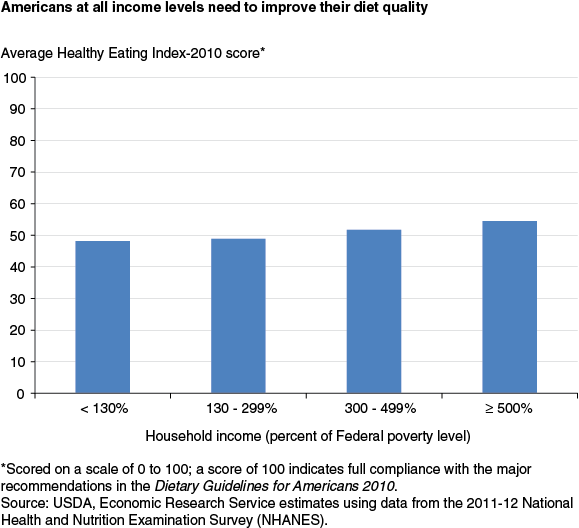
Using 24-hour dietary recall data from the 2011-12 NHANES, ERS researchers calculated Healthy Eating Index (HEI) 2010 scores for each survey respondent. The HEI measures compliance with dietary guidance on a 100-point scale; a score of 100 indicates the respondent’s food choices fully comply with the major recommendations in the Dietary Guidelines for Americans 2010. HEI-2010 scores over the entire sample ranged from 0 to 95.
Diet quality was then analyzed by income level. NHANES respondents were grouped into four income categories, ranging from those with incomes less than 130 percent of the Federal poverty level to those with incomes over 500 percent of poverty. (In 2012, the Federal poverty level for a family of four was about $23,000.) Average HEI-2010 scores for all income groups ranged from 48.1 to 54.5. On average, all income groups need to make healthier food choices.
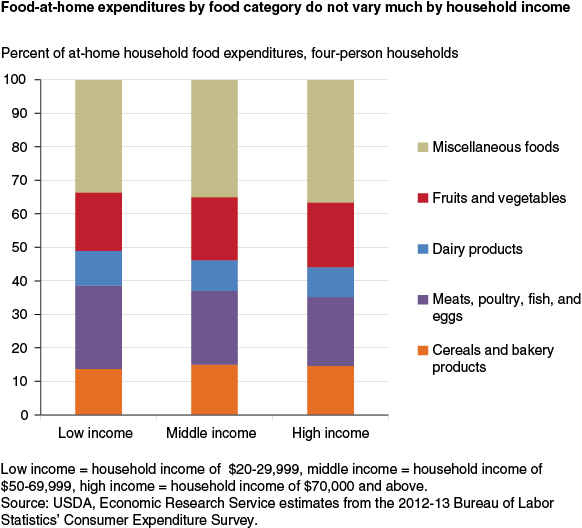
Data from the 2012-13 Bureau of Labor Statistics Consumer Expenditure Survey further confirm that households at all income levels tend to allocate their at-home food budgets for foods purchased in grocery stores and other retail stores similarly, allocating 8-11 percent of the budget to dairy, followed by bakery and cereal products (12-15 percent), fruits and vegetables (17-19 percent), and meat, poultry, seafood, and eggs (21-28 percent).
The largest expenditure category among all income groups (about 35 percent) is “miscellaneous foods” which includes soft drinks and other sugar-sweetened beverages, frozen meals, snacks, canned and packaged soups, salad dressings, candy, condiments, gourmet and specialty items, baby food, and seasonings. Some of the foods in the “miscellaneous foods” category are high in solid fats, added sugars, or sodium—nutrients that the Dietary Guidelines advise Americans to eat less of.
Higher Cost Diets Are Not Necessarily Healthier Than Lower Cost Diets
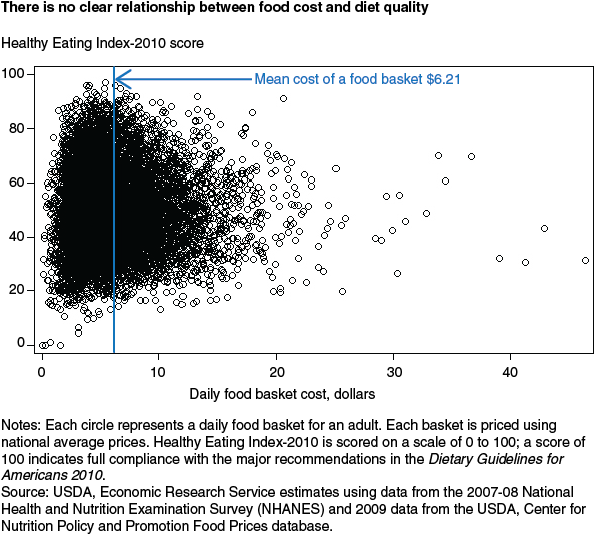
Some healthy diets appear to be available at a lower cost than some less healthy diets. To examine this, ERS researchers further investigated the “basket” of all foods consumed in one day by each adult who participated in NHANES. The total cost of each basket was estimated using USDA’s Center for Nutrition Policy and Promotion 2009 Food Prices Database, which assigns a national average price to each food reported in NHANES as if it were prepared at home (i.e., purchased at a retail food store). To better proxy for actual food costs, ERS researchers inflated the national average price of foods that NHANES 2007-8 participants purchased from a food-away-from-home source—such as a restaurant, sandwich shop, fast food place, or a movie theater—to account for the additional services these venues provide.
Food basket costs varied, just as diet quality (as measured by HEI-2010 scores) varied among NHANES respondents. Eighty percent of the baskets cost between $3.04 and $11.25 per day, and HEI scores for those baskets mostly fell between 29.1 and 79.2. Healthy and less healthy daily food baskets were available at all cost levels.
Behavioral Changes Can Lead to Improvements in Overall Diet Quality
Consumer behavior experts at Cornell University’s Food and Brand Lab argue that people make over 200 decisions a day related to food. These decisions range from choices on where to purchase the food—from a grocery store or a restaurant—to decisions about what to eat at each meal and what size plate to use. A person might also decide whether to do something else while eating, such as watch TV, ride in a car, or talk to friends and family. Somewhere in the mix of choices might be a decision to choose something healthy over something less healthy.
ERS research examined the relationship between specific food behaviors, food costs, and the healthfulness of the diet. The approach first controlled for multiple factors that other researchers have identified as being predictors of better diet quality—such as demographic factors, health behaviors including exercise and smoking and alcohol consumption, and eating foods from grocery stores versus food-away-from-home sources. Seven behavior changes were identified that would allow a consumer to improve his or her diet without increasing food costs. Three of these changes reduced costs and had the same or better effect on improving diets than spending $1 more per day on food.
Substituting a typical restaurant or fast food meal with a typical home-prepared meal produced the greatest cost savings and dietary improvement of the behaviors studied. For example, when a consumer purchased the pre-made components and basic ingredients to prepare a meal at home instead of purchasing a meal at a fast food place or having a pizza delivered, daily food costs fell by 92 cents and the HEI score rose by 3.2 points. This increase in HEI score was larger than the 1.9-point increase the same consumer would achieve by spending $1 more on food. The model did not account for the cost of time to prepare the meal, but the prices used in the model do reflect the use of convenience products, such as frozen foods, canned beans, and bottled sauces in preparing meals at home. Eating the same way on the weekend as during the week saved $0.22 a day and had the same impact on diet quality as if the same consumer spent $1 more on food.
Other behavior changes also lowered food costs and improved diet quality, but to a smaller extent. Increasing the share of daily calories consumed at breakfast by 10 percent raised the HEI score by 0.3 points and saved 12 cents. Decreasing the share of daily calories consumed as snacks by 10 percent had similar positive, but smaller, effects.
| Behavior change | Change in total daily food cost ($) |
Change in Healthy Eating Index—2010 score* (point) |
|---|---|---|
| Spend $1 more per day on food | 1.00 | 1.9 |
| Replace one meal from a fast food place (33 percent of calories) with store food | -0.92 | 3.2 |
| Replace one meal from a table service restaurant (33 percent of calories) with store food | -1.19 | 2.6 |
| Eat the same on weekends as Monday through Thursday | -0.22 | 1.9 |
| Replace one meal from other away-from-home eating places (33 percent of calories) with store food | -0.93 | 0.0 |
| Increase share of daily calories from lunch by 10 percent | 0.00 | 0.4 |
| Increase share of daily calories from breakfast by 10 percent | -0.12 | 0.3 |
| Decrease share of daily calories from snacks by 10 percent | -0.08 | 0.2 |
| *Scored on a scale of 0 to 100; a score of 100 indicates full compliance with the major recommendations in the Dietary Guidelines for Americans 2010. Source: USDA, Economic Research Service using data from the 2003-04 National Health and Nutrition Examination Survey (NHANES) and 2004 data from the USDA, Center for Nutrition Policy and Promotion Food Prices database. |
||
Big Improvements in Diet Quality Require Changing How the Food Budget Is Allocated
While behavioral changes such as these lead to improvements in diet quality, even larger improvements will be necessary to meet the Dietary Guidelines. To achieve this, consumers will likely need to shift dollars from protein foods and foods and beverages high in solid fats, added sugars, and sodium, to fruits without added syrups, and vegetables unadorned with fatty sauces or sugary or fatty salad dressings.
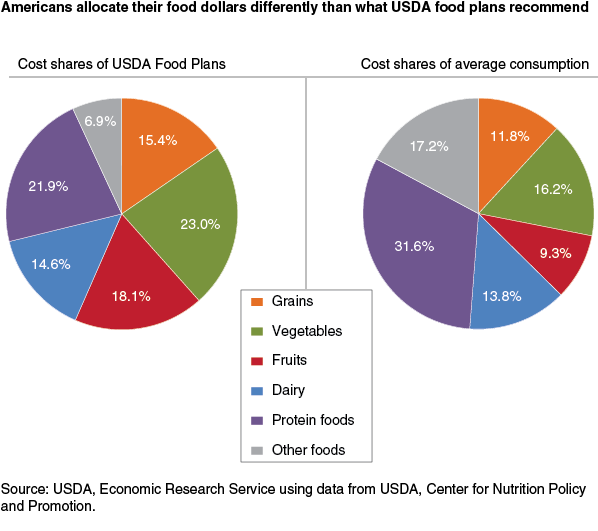
To illustrate how a family might purchase a healthy diet at a variety of cost levels, USDA produces four food plans. The lowest cost plan—the Thrifty Food Plan—serves as the basis for maximum benefit amounts for USDA’s Supplemental Nutrition Assistance Program (SNAP). To generate each food plan, USDA economists and nutritionists use an optimization model to define a diet that is as close as possible to current consumption patterns while meeting the Dietary Guidelines for Americans, and within the designated food spending constraint. The USDA Food Plans include all foods that are eaten in a day, but foods purchased from restaurants, fast food outlets, and other away-from-home sources are priced as if they were prepared at home. Each of the four USDA Food Plans allocates a similar share of the given budget to fruits and vegetables (41 percent), dairy (15 percent), grains (15 percent), protein foods (22 percent), and “other foods” (7 percent).
The typical American household allocates its food dollars very differently. Protein foods account for 32 percent of average food costs, and fruits and vegetables account for only 26 percent of food costs. “Other foods,” which the USDA Food Plans recommend limiting to not more than 7 percent of food costs, account for 17 percent. “Other foods” includes fats, oils, and sweets such as salad dressings, gravies and sauces, soft drinks and other sugar-sweetened beverages, candy, frozen foods (except frozen fruits and vegetables), and coffee and tea.
Wide Variety of Fruits and Vegetables Are Affordable If Low-Income Households Follow the Thrifty Food Plan Budget
ERS research shows that if households spend the equivalent of the Thrifty Food Plan but allocate only 26 percent of their food budget to fruits and vegetables, they will not be able to purchase a sufficient quantity and variety of fruits and vegetables to meet the Dietary Guidelines for Americans. However, by increasing fruits and vegetables’ food budget share to around 40 percent as the USDA Food Plans recommend, those same households will be able to purchase the quantity and variety of fruits and vegetables needed to meet dietary guidance, at the same food spending level.
To illustrate this with 2013 prices, ERS researchers use the example of a family of four—a man and woman ages 31-45, one 6-8 year-old child, and one 9-11 year-old child. The Thrifty Food Plan cost for this family in 2013 is $146 per week. If the family follows the typical food spending pattern and allocates 26 percent of the food budget to fruits and vegetables, it will have $38 per week for fruits and vegetables. The family would need to select fruits and vegetables that on average cost less than $0.31 per cup to purchase the 123 cups needed to meet the Dietary Guidelines for the week.
Calculations by ERS researchers on the cost per cup for 156 commonly consumed fresh, frozen, and canned fruits and vegetables reveal that 24 fruits and vegetables—15 percent of the 156 fruits and vegetables—cost less than $0.40 per cup. However, these 24 fruits and vegetables do not include any dark green vegetables, and the only red-orange vegetable available is fresh whole carrots.
If the family decided to follow the Thrifty Food Plan budget and allocate about 40 percent of its food budget to fruits and vegetables, the family would then have $58 to spend on fruits and vegetables, or about $0.47 per cup. The family could choose from more than 100 low to medium cost fruits and vegetables at this $0.47 average cost level, about 70 percent of the 156 fruits and vegetables priced by ERS. This list includes several options from each of the vegetable sub-groups (legumes, dark green, red and orange, starchy, and all others).
In order to free up these additional funds for fruits and vegetables, USDA Food Plans suggest that Americans reduce expenditures on protein foods and “other foods.” By following recommendations to increase consumption of plant-based proteins (which are generally less expensive), consumers can afford seafood and healthier lean cuts of meat, while simultaneously meeting recommendations and reducing total spending on protein foods. Since “other foods” provide limited nutritional value, consumers can reduce their spending on “other foods” without adversely impacting diet quality.
Americans face a variety of challenges when trying to eat a healthy diet, but the total amount consumers currently spend on food is not the primary barrier to healthy eating. ERS research suggests that the challenge is to redistribute food dollars towards healthier foods. Together, the Dietary Guidelines for Americans, MyPlate, and the USDA Food Plans illustrate how Americans can consume a healthy diet at a variety of cost levels by allocating more of their food dollars and more of their plate to fruits and vegetables, and less to protein foods and foods high in solid fats, added sugars, and sodium.
This article is drawn from:
- Fruit and Vegetable Prices. (n.d.). U.S. Department of Agriculture, Economic Research Service.
- 'Food Costs, Diet Quality and Energy Balance in the U.S'. (2014). Physiology and Behavior 134:20-31.
- 'Association between Total Diet Cost and Diet Quality is Limited'. (2014). Journal of Agricultural and Resource Economics 39:1-22.
You may also like:
- Food Consumption, Nutrient Intakes, and Diet Quality. (n.d.). U.S. Department of Agriculture, Economic Research Service.
- Guthrie, J. & Lin, B. (2014, May 5). Healthy Vegetables Undermined by the Company They Keep. Amber Waves, U.S. Department of Agriculture, Economic Research Service.
- Fruit and Vegetable Prices - Interactive Chart: Costs per Edible Cup Equivalent. (n.d.). U.S. Department of Agriculture, Economic Research Service.