A Look at What’s Driving Lower Purchases of School Lunches
- by Katherine Ralston and Constance Newman
- 10/5/2015
Highlights
- The participation rate for full-price, or paid, school lunches declined from fiscal year 2008 through fiscal year 2014, with steeper declines during fiscal years 2012-14.
- Recent policy changes may have contributed to the decline in paid-lunch participation, including updated requirements for foods and nutrients in school meals as well as new rules for revenues that must be obtained for paid meals.
- Recent studies suggest that while many school districts have adjusted to new standards, maintaining full-price lunch participation remains most challenging for smaller, more rural, and more affluent districts.
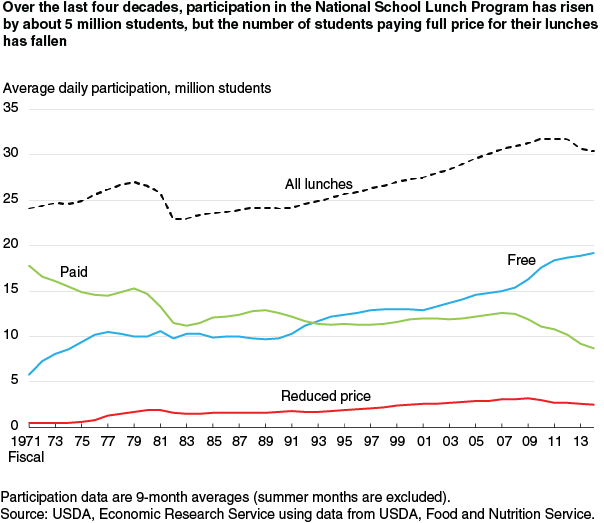
On a typical schoolday in October 2014, over 30 million U.S. schoolchildren and teens took their trays through the lunch line. Seventy-two percent of these students received their meals for free or paid a reduced price, and the remaining 28 percent purchased the full-price lunch.
Since its start in 1946, USDA’s National School Lunch Program (NSLP) has served meals to children at all income levels, providing children with healthy meals and helping prevent the stigma that could occur if school meals were perceived as limited to those from low-income homes. In recent years, however, the share of children paying full price for their lunches has declined, falling from 40 percent in fiscal 2008 to 28 percent in fiscal 2014, continuing a longer downward trend.
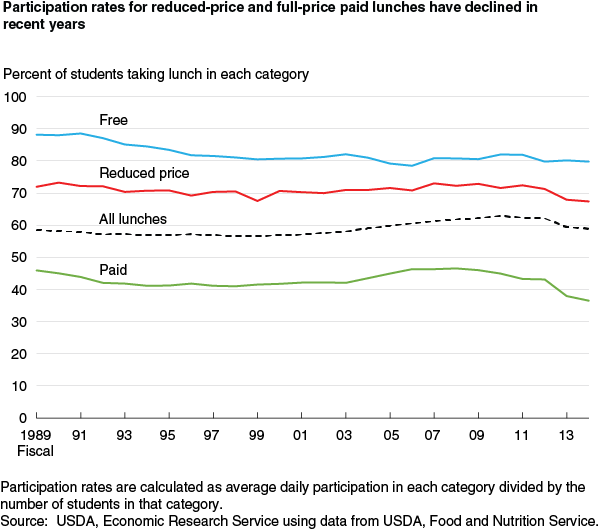
The decline since 2008 partly reflects the increase in the number of students certified for free and reduced-price meals following the 2007-09 recession. But the shift also reflects a decline in the participation rate for full-price lunches—the share of students not certified for free or reduced-price meals who buy school lunches at the full price. In fiscal 2008, 47 percent of students who were not certified for free or reduced-price lunches chose to buy the full-price lunch. By fiscal 2014, the full-price participation rate was 37 percent, somewhat below the average level during the 1990s. A combination of reasons—both economic factors and policy changes—are affecting participation decisions in the Nation’s school lunchrooms.
After Program Launched, School Lunches Grew With Downturns in 1981 and 2010
The NSLP was founded by the National School Lunch Act in 1946 as a way to provide permanent Federal support to earlier State and local efforts that provided meals to schoolchildren. The Act defined its purpose “as a measure of national security, to safeguard the health and well-being of the Nation’s children,” partly in response to concerns that many American men had been rejected for World War II military service because of diet-related health problems.
The NSLP plays an important role in the diets of children. Free and reduced-price lunches are particularly important for providing access to nutritious meals for children from low-income households. Analyses of nationally representative data on children’s diets during 2005-10 found that among students eligible for free or reduced-price meals, those who participated in the school lunch program were more likely to have adequate intakes of vitamin A and calcium than students who did not participate in the program.
In school year 2014-15, NSLP reimbursed school districts $2.98 for free meals served to students from families with incomes below 130 percent of the poverty line; $2.58 for reduced-price meals to students with family incomes between 130 and 185 percent of the poverty line, who pay no more than 40 cents for a lunch; and $0.28 for meals served to higher income students, who purchase lunch at the full or “paid lunch” price. School districts in Alaska and Hawaii and those in high-poverty districts received higher reimbursement rates per meal, and all school districts receive “USDA Foods,” foods purchased by USDA based on district orders and donated to school meal programs (or cash in lieu of these commodities). In addition, school districts that were certified as compliant with updated nutrition requirements (about 90 percent of districts in 2014) received an additional $0.06 for every NSLP lunch served.
The NSLP has grown over the decades to become nearly universal in its coverage: almost all U.S. public schools participate in the program, as do many private schools. Average daily participation—the number of students taking lunch—grew from 24 million students in fiscal 1971 to 27 million in 1979 before declining to 23 million in 1982, following a tightening of access to free meals, a reduction in meal reimbursement rates, and an increase in paid-lunch prices, all in combination with an economic downturn. Upward growth resumed to a peak of 32 million students in fiscal 2011, followed by a decline to 30 million in fiscal 2014.
The decline in average daily participation for total meals since fiscal 2011 appears to be driven by a drop in students taking paid lunch that began even earlier, in fiscal 2008. A sharp increase in students taking free lunch during fiscal years 2008-11 as a result of the 2007-09 recession made up for the drop in students taking paid lunch—free lunches simply replaced paid lunches. But during fiscal years 2011-14, students taking free lunch grew more slowly, while students taking paid lunch continued to fall at roughly the same pace.
After the 2007-09 Recession, Participation Rates for Paid Lunches Fell the Most
Participation rates—the proportion of students in each certification category who take either free, reduced-price, or paid lunch—also played a role in daily participation trends. Participation rates for free lunches declined from 88 percent in fiscal 1989 to 80 percent in fiscal 1999, with small fluctuations since then. The participation rate for reduced-price lunches has fluctuated around an average of 71 percent, with low points of 67 percent in 1999 and 2014.
Paid-lunch participation was the major driver in the recent decline of the overall participation rate. After having increased during the 2000s, the paid-lunch rate dropped 10 percentage points, from 47 percent in fiscal 2008 to 37 percent in fiscal 2014. The decline in the paid-lunch participation rate was sharpest during fiscal years 2012–2014, with a drop of 6.6 percentage points in that period alone, compared to a 3.4-percentage-point decline during fiscal 2008 to 2012. The drop from 2012 to 2013—5.3 percentage points—accounted for most of the 2012-14 drop.
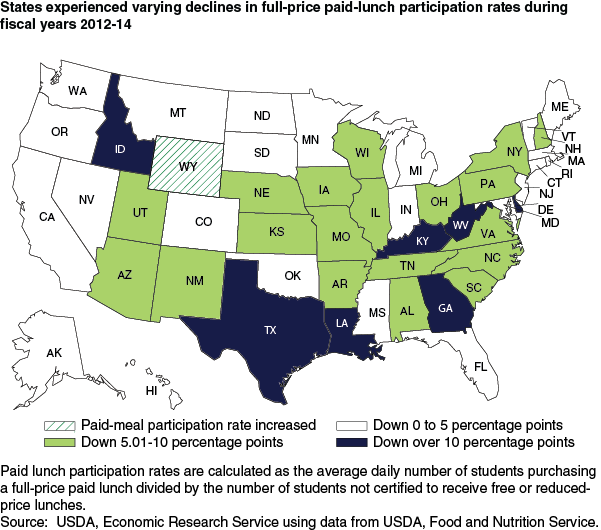
Declines in participation rates from fiscal years 2012 to 2014 varied across States, with paid-lunch participation rates dropping over 10 percentage points in seven States plus the District of Columbia. Wyoming experienced growth in the paid-participation rate during fiscal years 2012-14, and eight more States showed growth in paid-participation rates between fiscal years 2013 and 2014, though not enough to make up for the drop between fiscal years 2012 and 2013.
School Meals Revamped To Conform With Nutritional Guidance
The decline in paid-lunch participation may reflect a combination of factors. The 2007-09 recession and slow recovery not only resulted in more students qualifying for free lunches but also reduced the ability of many noneligible families to pay for lunch. Previous ERS research found that between 2005-06 and 2009-10, working-age Americans cut back on the number of meals and snacks eaten away from home, as unemployment both reduced incomes and increased the time available for preparing meals at home. This economizing behavior may have also been applied to buying lunch at school. Families may have chosen to pack their children’s lunches rather than purchase the full-price school lunch, both because money was tighter and because time for packing lunches was more available.
At the same time, major changes were made to school meal program reimbursements and revenue requirements, along with changes to the meals themselves. In 2010, Congress passed the Healthy, Hunger-Free Kids Act. The Act addressed concerns about the nutritional quality of children’s diets, school meals, and competitive foods available in schools (those not part of the school meal, such as a la carte items or foods and drinks sold in vending machines). Key provisions of the Act also addressed concerns about the financial and administrative challenges of school meal operations.
In implementing the Act, USDA promulgated rules requiring lunches to include minimum servings per week of specific categories of vegetables, including dark green and red/orange vegetables, as well as changes to increase whole grains while limiting calories and sodium. USDA developed the updated school meal patterns drawing on recommendations from the Institute of Medicine of the National Academies of Sciences, Engineering, and Medicine as well as the 2010 Dietary Guidelines for Americans. These rules took effect starting with school year 2012-13.
Some school lunch standards were gradually phased in. For school year 2012-13, half of grain products were required to be whole-grain rich (meaning at least half of grain content must be whole grain), and in school year 2014-15, all grain products were required to be whole-grain rich. States can grant an exemption from the requirement through school year 2015-16 for school districts that demonstrate difficulty obtaining acceptable products to meet the requirement; these districts must still meet the requirement that at least half of grain offerings be whole-grain rich.
The updated standards set a ceiling on total calories per average lunch in addition to existing minimum calorie requirements, with upper restrictions ranging from 650 kilocalories (kcal) for grades K-5 to 850 kcal for high schools. Total sodium levels for average lunches offered were also limited for the first time to 1,230 milligrams (mg) (grades K-5), 1,360 mg (grades 6-8), and 1,420 mg (grades 9-12) per average lunch by July 1, 2014, with intermediate and final targets scheduled for school years 2017-18 and 2022-23. Consistent with congressional directives, however, USDA will reassess the evidence of benefits of reducing sodium intake by children before requiring school compliance with the school year 2017-18 and final sodium targets.
Many school districts have adjusted to the updated menu requirements. Researchers at the University of Illinois at Chicago conducted a nationally representative survey of principals and food service managers at 557 elementary schools in 2013 to assess the reaction to the updated standards. Sixty-three percent of respondents agreed that “Students generally seem to like the new school lunch,” and 7 percent strongly agreed with the statement. When comparing overall school lunch participation in 2013 to the previous year, 65 percent of survey respondents said that participation was about the same and 13 percent said it was higher and that the percentage of the meal consumed was about the same (59 percent) or more (by 11 percent) than the previous year.
In the same study, school foodservice directors from rural, smaller, and wealthier school districts were significantly more likely than those from suburban or urban, larger, or poorer districts to report decreases in paid-lunch participation after updated lunch standards were implemented. Also, a smaller study from Houston found that middle school students were less accepting of the changes than younger students.
Higher Lunch Prices Could Also Be a Factor in Declining Lunch Purchases
While the decline in purchases of paid lunches during fiscal years 2012-14 appears to be timed with the implementation of updated requirements for foods and nutrients in school meals, price increases for paid lunches that began in 2011 under the Paid Lunch Equity provision could also have contributed. This increase was implemented to prevent Federal free and reduced-price lunch subsidies from being used to offset the paid lunch costs.
The Paid Lunch Equity provision requires districts to work towards making the revenue from paid lunches to equal the difference between the reimbursement rates for free lunches and paid lunches. For example, in school year 2014-15, the reimbursement rate for free lunches, including an additional $0.06 for compliance with updated meal standards, was $3.04 and the reimbursement for paid lunches, together with the additional 6 cents, was $0.34. The difference of $2.70 would represent the “equity” price. A district charging $2.00 for a paid lunch would be required to obtain an additional $0.70 per meal, on average, by gradually raising prices or adding non-Federal funds to make up the difference over time. Until the gap is closed, districts must increase average revenue per lunch, through prices or other non-Federal sources, by 2 percent plus the rate of inflation, with minimum increases capped at 10 cents in a given year, with exemptions under certain conditions.
Higher prices for paid lunches run the risk of reducing participation. A nationally representative study from school year 2005-06 found that a 10-percent increase in lunch price was associated with a decline of 1.5 percentage points in the participation rate of paid lunches, after controlling for other characteristics of the meal and the school foodservice operation.
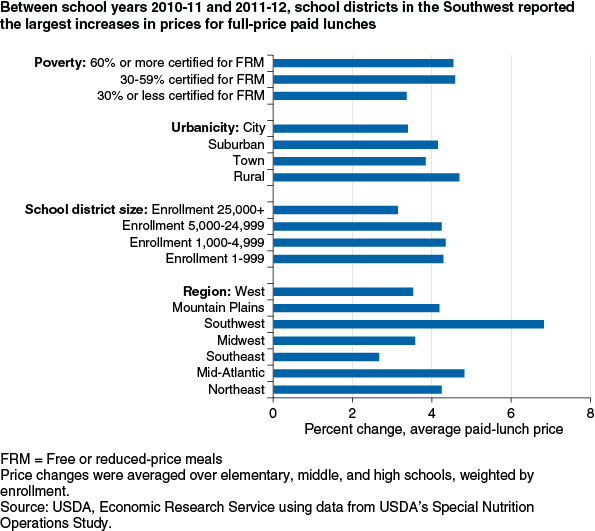
Another nationally representative survey conducted in 2012 found that lunch prices rose 4.2 percent in elementary schools and 3.3 percent in middle and high schools, on average, between school years 2010-11 and 2011-12. Applying the earlier results on effects of differences in lunch prices on paid-lunch participation rates, these price increases would be expected to lead to declines in participation rates of 0.6 percentage points for elementary school and 0.5 percentage points for middle and high school. These estimates suggest that price increases related to the Paid Lunch Equity provision could have contributed modestly to the decline in participation rates for paid lunches.
Rural districts reported larger price increases in percentage terms than urban districts, and smaller districts reported larger price increases than larger districts, according to ERS calculations using data from the 2012 survey. Rural school districts reported an average increase of 4.7 percent in the prices charged for paid lunches compared to an average increase of 3.4 percent for city districts. Paid-lunch prices rose by an average of 6.8 percent for school districts in the Southwest, and paid-lunch prices in Mid-Atlantic districts rose by 4.8 percent between school years 2010-11 and 2011-12. While the effect of these price increases on participation cannot be measured with these data, the effect of prices on participation found in the 2005-06 study suggest that areas with higher price increases would experience greater reductions in participation from the Paid Lunch Equity provision.
Other School Lunch Changes Could Help Increase Overall Participation
To improve the overall school nutrition environment and support healthy food choices across schools, new standards were established for competitive foods. Starting in school year 2014-15, the new rules cover a la carte items offered by the food service program as well as vending machine sales and items sold at other venues either controlled by the school foodservice program or another entity. Nicknamed “Smart Snacks in School,” allowable competitive foods must meet limits on calories, total and saturated fat, trans-fat, sugar, and sodium and contribute to servings of healthy food groups. Beverages must meet size restrictions and are limited to water, milk and full strength juice in elementary and middle schools, with low-sugar or no-sugar carbonated and caffeinated beverages allowed in high schools. Another new regulation requires that prices students pay for competitive foods must cover the cost, which was not always the case according to a national survey in school year 2005-06.
While the impacts of the new competitive foods standards and price requirements have not been measured yet, national data from school year 2004-05 and subsequent pilot studies in California and Texas suggest that if stricter nutritional standards and/or more accurate pricing reduced the appeal of competitive foods, students might choose the NSLP school meal instead.
Overall NSLP participation may also be helped by the Community Eligibility Provision (CEP), a new option that allows schools in low-income areas to offer school meals at no charge to all students. Under CEP, a district may offer all meals at no charge in any school where 40 percent or more of students are certified for free meals without an application (known as “identified students” through “direct certification”). Such students may be certified through participation in other income-based programs such as the Special Nutrition Assistance Program (SNAP), Temporary Assistance for Needy Families, and the Food Distribution Program on Indian Reservations, or they may qualify as runaway, homeless, migrant, or foster youth.
The CEP may be used districtwide, for a group of schools in a district, or even for a single school within a district if that school or group meets the 40-percent requirement. Under CEP, a share of meals served (equal to the identified student percentage multiplied by 1.6) is reimbursed at the free rate, and remaining meals are reimbursed at the paid rate, with no reduced-price category and with any additional costs paid from non-Federal sources. CEP reduces administrative burden even further than previously available options for offering universal free meals.
After pilot programs starting in school year 2011-12, CEP became available nationwide in school year 2014-15. An evaluation of seven early adopting States found that CEP increased student participation in NSLP by 5 percent relative to comparable schools that did not participate in CEP. The increase in overall participation associated with CEP may result not only from the expansion of free lunches, but also from reduced stigma and faster moving lunch lines due to the elimination of payments.
The Healthy, Hunger-Free Kids Act also included measures intended to further expand direct certification of children eligible for free meals through participation in SNAP or other means-tested programs, which could increase the number of students receiving free lunches in some districts and the number of districts that may find the CEP financially attractive.
Looking Forward
While not fully understood, the decline in paid-lunch participation rates since 2008 highlights the challenge of serving healthier meals across a diverse landscape of school meal programs.
Accommodations in implementing the regulations and further training, such as USDA’s Team Up for School Nutrition Success initiative, may help districts still experiencing challenges with updated nutrition standards. This initiative provides customized technical assistance to school districts through workshops, webinars, and peer-to-peer mentoring, tailored to meet the needs of the participants. Topics covered include menu planning, financial management, food safety, procurement, and meal presentation and appeal, as well as youth-engagement tactics and strategies to reduce plate waste.
The Community Eligibility Provision will likely help more eligible schools in high-poverty areas provide free lunches to all students and contribute to higher overall participation in those districts. These measures may support the broad participation by students of all incomes that has historically reduced the risk of stigma for students receiving free meals, as well as providing access to healthy lunches for all students.
This article is drawn from:
- Ralston, K. & Newman, C. (2015). School Meals in Transition. U.S. Department of Agriculture, Economic Research Service. EIB-143.
You may also like:
- Todd, J.E. & Morrison, R.M. (2014, March 4). Less Eating Out, Improved Diets, and More Family Meals in the Wake of the Great Recession. Amber Waves, U.S. Department of Agriculture, Economic Research Service.
- Newman, C. (2013). Fruit and Vegetable Consumption by School Lunch Participants: Implications for the Success of New Nutrition Standards. U.S. Department of Agriculture, Economic Research Service. ERR-154.
- Guthrie, J., Newman, C., Ralston, K., Prell, M. & Ollinger, M. (2013). Nutrition Standards for Competitive Foods in Schools: Implications for Foodservice Revenues. U.S. Department of Agriculture, Economic Research Service. EIB-114.
- Hanson, K. & Oliveira, V. (2012). How Economic Conditions Affect Participation in USDA Nutrition Assistance Programs. U.S. Department of Agriculture, Economic Research Service. EIB-100.
- Ralston, K., Newman, C., Clauson, A., Guthrie, J. & Buzby, J.C. (2008). The National School Lunch Program Background, Trends, and Issues. U.S. Department of Agriculture, Economic Research Service. ERR-61.


