
Measuring Access to Food in Tanzania: A Food Basket Approach
- by Nancy Cochrane and Anna D'Souza
- 3/2/2015
Highlights
- ERS developed a set of regional, representative food baskets for Tanzania that can be used to measure access to food.
- Results of the analysis show wide variations in diets across the geographical regions of Tanzania; maize (corn) provides the bulk of calories in the maize-growing regions in the south while in other regions, households favor cassava and bananas.
- Access to food has been stable over time, but the lowest two income quintiles face potential problems with access, and households in the north are worse off than those in the south due to lower incomes and higher food prices.
Although Tanzania is rich in agricultural resources and is a net exporter of maize, the country is among the world’s poorest, suffers from periodic droughts that reduce harvests, and is subject to chronic food insecurity. Agriculture accounts for 27 percent of Tanzania’s Gross Domestic Product (GDP) and employs 80 percent of its labor force. Much of the population is engaged in small-scale agriculture, which generates both income and a substantial portion of their food. ERS estimates that 5 million people, out of a total population of 48 million, were food insecure in Tanzania in 2014, and this number is projected to grow to 14 million by 2024. The principal tool currently used by Tanzania to address food insecurity is the distribution of food aid to vulnerable households. A key challenge faced by the Governments of Tanzania and other countries coping with food insecurity is to identify the households most in need of assistance.
ERS researchers developed a measure of household access to food over time, using representative food baskets to compare food costs to household income. When measuring the extent of food insecurity and identifying vulnerable households, it is informative to evaluate the four pillars of food security, as identified by the United Nations (UN) Food and Agriculture Organization (FAO): availability refers to the physical existence of food, including production, stocks, and net trade; access refers to a household’s ability to obtain food, which depends on income, prices, and distance to local food markets; utilization refers to an individual’s ability to process nutrients and energy from food, which depends on many factors including dietary diversity and nutrient absorption, intra-household allocation of food, and hygienic preparation; and “stability” refers to the stability of the other three pillars over time. Procedures currently in place in Tanzania to measure food security tend to focus on availability, and assistance is targeted to regions experiencing production shortfalls. Measuring access in addition to availability can help identify households in surplus-producing regions that lack the financial resources to purchase available food.
The food baskets constructed by ERS include 15 food groups, chosen because of their role in the Tanzanian diet and the availability of retail prices. The groups are maize, rice, beans, cooking bananas, millet/sorghum, potatoes, sweet potatoes, wheat and other grains, cassava, poultry, beef and goat, fish, cooking oil, ripe bananas, and mangoes and other fruits. The selected foods make up over 80 percent of average daily calories, except in Dar es Salaam, where they make up 67 percent. The food baskets were calculated using food consumption data from the 2010/11 Tanzanian National Panel Survey (TZNPS), a nationally representative household survey carried out by the Tanzanian National Bureau of Statistics (NBS), with assistance from the World Bank. ERS researchers used calorie shares estimated from the TZNPS to construct food baskets that achieve the per capita daily calorie intake estimated for Tanzania by FAO (2,137 calories per day). Using retail prices collected by NBS, the researchers calculated the monthly cost of the food baskets for various groups of Tanzanian households. Comparing the cost to per capita income provides a measure of access.
Methods commonly used to measure food security tend to focus on the situation at the national level. The method used by ERS in its annual International Food Security Assessment calculates availability of staple foods as the sum of production plus imports minus exports, waste and losses, and change in stocks. Availability of each food is converted to a grain equivalent and then summed to give a single measure of food availability in the country. The World Food Programme (WFP) conducts period surveys asking about frequency of consumption of different food groups. Based on the results, WFP calculates a dietary diversity measure, which it uses as a proxy for access. The Global Food Security Index developed by the Economist Intelligence Unit is an aggregate of 30 different indicators, which together measure availability, access, and utilization.
These national-level approaches provide a good picture of a country’s overall food security situation and are useful for cross-country comparisons. The food basket approach used in this study can enhance this understanding by providing details on subnational differences in diets and linking to markets and prices. This approach can help identify regions where overall food supplies may be adequate but where a number of households still experience problems with access. The availability of monthly retail prices enables analysts and policymakers to track changes in food access over time.
Production Patterns and Dietary Preferences Vary Widely Across Geographical Regions
Mainland Tanzania is divided into 21 administrative regions, which were grouped into 7 geographical administrative zones. Consumption patterns were estimated for each of the seven zones. Food baskets were constructed for Dar es Salaam and two zones: the Southern Highlands, which includes the regions of Mbeya, Iringa, and Rukwa; and the northwest Lake Zone, which includes the regions of Mara, Mwanza, and Kagera (all of which border on Lake Victoria). The two zones were chosen to highlight the broad geographical diversity in production and consumption across Tanzania. ERS researchers made site visits to major population centers in these two zones, and interviews with local officials and nutrition experts largely confirmed the survey results.

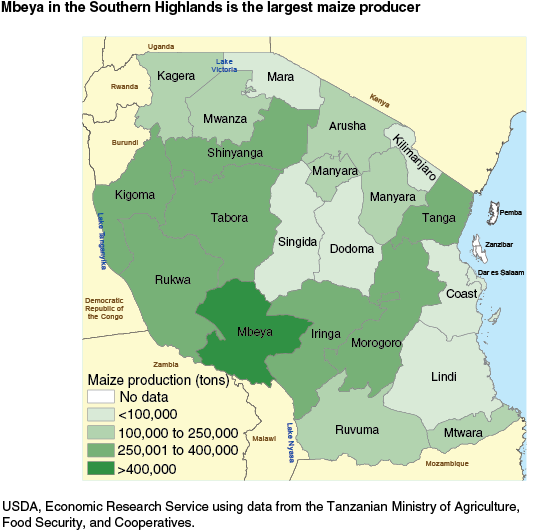
Considerable geographical variation exists in agricultural production. The major maize-growing region is the Southern Highlands. This area is typically a surplus-producing region, with maize from this region shipped to other regions and neighboring countries. The regions in the Lake Zone and other regions in the north (including Arusha and Kilimanjaro) grow less maize and more bananas and cassava, as well as some millet and sorghum. The regions of Mbeya and Iringa (in the Southern Highlands zone) and Morogoro (in the Eastern zone) are the largest rice producers, although Tanzania is a net importer of rice.
The Tanzanian diet relies heavily on starchy staples. Maize is a major staple food throughout mainland Tanzania, providing over 40 percent of household calories. However, there is considerable geographical variation; maize accounts for 51 percent of total calories in the Southern Highlands, and even in the Lake Zone where it accounts for 32 percent of calories, maize makes up a larger share of calories than any other food. For households in the Lake Zone, cassava is the other key staple, providing about 19 percent of total calories; cassava consumption is much lower in the Southern Highlands (4 percent). Rice, beans, and cooking bananas are important to the diets in both zones, although banana consumption is higher in the Lake Zone. White potato consumption is low throughout the country, but consumption of sweet potatoes is somewhat higher, especially in the Lake Zone. In most areas, beans are the main source of protein.

Consumption of animal products is low throughout the country but is lowest in the Southern Highlands. Fish is a large source of protein in the Lake Zone, followed by beef and goat, then poultry. Fish is also eaten in the Southern Highlands but makes up a smaller share of total calories. Dairy products were not included in the food basket because their calorie shares were negligible. Vegetables (apart from the starchy vegetables) were also not included—the total calorie share for all vegetables was just 1 percent, even in Dar es Salaam.
In Dar es Salaam, maize makes up 23 percent of calories; rice is the other major staple, providing about 21 percent of calories. Diets in the city are generally more diverse, perhaps because of higher average incomes and/or greater access to markets. (Foods from the 15 tracked food groups make up only 67 percent of total calories consumed, compared to 83-88 percent for other areas.)
Constructing the Food Baskets
Using calorie shares derived from the survey results, ERS researchers targeted a daily per capita intake of 2,137 calories, which is the average daily per capita calorie intake calculated by FAO in its 2009 Food Balance Sheet for Tanzania. The daily quantities (grams) of food were derived using estimates of calories per kilogram provided by the Tanzanian National Bureau of Statistics (NBS). Daily quantities were multiplied by 30 to derive a monthly average.
| Food item | Dar es Salaam | Southern Highlands | Lake Zone |
|---|---|---|---|
| Maize | 4.08 | 8.82 | 5.53 |
| Rice | 3.74 | 1.62 | 1.50 |
| Beans | 1.05 | 1.37 | 1.29 |
| Bananas | 0.46 | 0.85 | 2.45 |
| Millet/sorghum | 0.15 | 0.15 | 0.67 |
| Potatoes | 0.53 | 0.71 | 0.37 |
| Sweet potatoes | 0.21 | 0.55 | 2.08 |
| Wheat/other grains | 0.13 | 0.02 | 0.01 |
| Cassava | 0.49 | 1.75 | 8.36 |
| Poultry | 0.14 | 0.07 | 0.15 |
| Beef/goat | 0.64 | 0.37 | 0.44 |
| Fish | 0.71 | 0.65 | 1.42 |
| Cooking oil | 0.62 | 0.37 | 0.28 |
| Ripe bananas | 0.30 | 0.31 | 0.25 |
| Mangoes/other fruit | 0.63 | 0.38 | 0.89 |
| Source: USDA, Economic Research Service using data from Government of Tanzania 2010-11 National Panel Survey. | |||
The estimated food baskets are representative—that is, they reflect the typical diet patterns for each zone but do not necessarily comprise a nutritionally optimal diet. Preliminary analysis suggests that the Southern Highlands diets are sufficient in protein, according to average USDA daily requirements, because of the dominance of maize but are deficient in many vitamins and minerals. The Lake Zone diet is deficient in protein, as well as most micronutrients. More nutritious food baskets would include more beans, animal products, groundnuts, and leafy green vegetables. (Groundnuts and leafy green vegetables are grown in Tanzania but are not frequently consumed.)
The monthly nominal cost of the food baskets was calculated using retail prices collected by NBS from the major markets in each zone. TZNPS results indicate that, on average, mainland households derive 25 percent of their food consumption from their own production; this share is 32 percent among rural households. This portion of food consumption was valued at local market prices.
The food baskets represent 67 to 88 percent of the total calories typically consumed by one person in a month. To give policymakers a more accurate picture of the food security situation, researchers estimated the cost of a total food basket by including the cost of other foods that households consume, including dairy products, vegetables, nuts and spices, sugar and sweets, and beverages (alcoholic and nonalcoholic). These food groups include small quantities of a wide array of products that are often difficult to measure and to value.
The expenditure shares denote the share of total food expenditures that were spent on each of the foods in the baskets. Expenditures on the basket of 15 food groups made up 57 percent of total food expenditures in Dar es Salaam, 69 percent in the Southern Highlands, and 80 percent in the Lake Zone. ERS researchers used these expenditure shares to estimate the value of other foods and combined this with the value of the 15 food groups in the baskets to get the total food basket cost.
The monthly food basket cost was lowest in the Southern Highlands due to relatively low maize prices and a relatively high-calorie share devoted to maize, as well as low consumption of high-priced items such as meat and fish. The food basket in Dar es Salaam was the most expensive, driven by generally higher food prices and greater consumption of higher priced foods such as rice, meat, and fish. The food basket for the Lake Zone was also relatively costly; maize prices were high, and the calorie share of maize, while lower than in the Southern Highlands, was still fairly high. Consumption of poultry, beef, and fish (relatively expensive items) was higher in the Lake Zone. The primary driver of the high cost, however, was the large calorie share devoted to cassava, which was an expensive source of calories, relative to maize in the Southern Highlands.
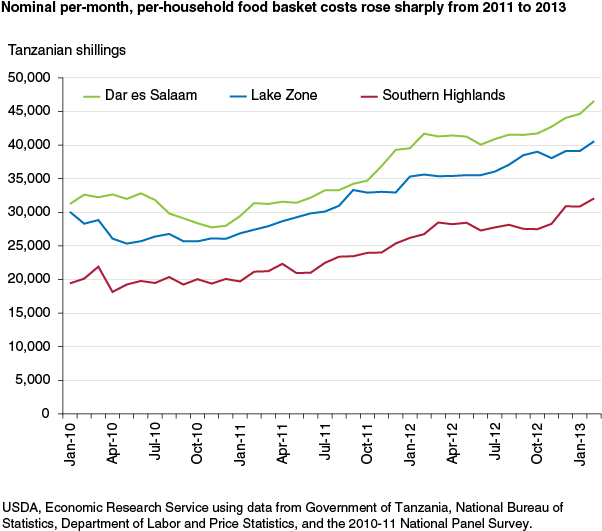
The sharp rise in the nominal costs of the food baskets that began in mid-2011 can be attributed largely to a surge in maize and rice prices in Tanzania. However, the real costs of the food baskets—calculated by deflating the nominal cost by the consumer price index from NBS—was more moderate than the rise in nominal costs.

Measuring Access
Food is just one expenditure for Tanzanian households, which also spend money on housing, clothing, school fees, and other essential goods and services. However, as in many developing countries, poor households in Tanzania spend the majority (on average, 75 percent) of their income on food.
Access to food was calculated as the ratio of the monthly food basket cost to monthly per capita income. If the ratio was greater than 0.50 (that is, if the cost of the food basket is over 50 percent of total household income), ERS researchers denoted the household as potentially food insecure. Decreases or increases in the ratio indicated improvements or declines, respectively, in access to food.
On average, access appears to be low only in the Lake Zone. In December 2012, for example, the average nominal cost of the Lake Zone food basket was 39,108 TSH. Average monthly per capita nominal GDP was 71,906 TSH, giving a ratio of 54 percent. The ratio for the Southern Highlands was 31 percent. The ratio for Dar es Salaam, where average monthly per capita GDP was 144,570 TSH, was also 31 percent. The aggregate numbers, however, mask significant variation across households within these zones. Income inequality in Tanzania is pronounced, and those in the lower income quintiles have more difficulty accessing food and coping with price increases than those in the upper quintiles.
Combining the GDP data with income quintile share data from the World Bank, ERS researchers calculated the national average per capita GDP by quintile. Based on these estimates, households in the bottom quintiles appeared vulnerable to food insecurity; the food basket cost exceeded 100 percent of average income in the bottom quintile.
| Income group | Quintile 1 | Quintile 2 | Quintile 3 | Quintile 4 | Quintile 5 |
|---|---|---|---|---|---|
| Average monthly per capita GDP (TSH) | 29,043 | 47,408 | 66,627 | 92,681 | 191,341 |
| Monthly food-basket cost as percent of income, December 2012 | |||||
| Dar es Salaam | 152 | 93 | 66 | 48 | 23 |
| Southern Highlands | 106 | 65 | 46 | 33 | 16 |
| Lake Zone | 135 | 0.82 | 59 | 42 | 20 |
| Note: GDP = gross domestic product. TSH = Tanzanian shillings (1 U.S. dollar = 1,666 TSH). Source: NBS, World Bank, authors’ calculations. |
|||||
Limitations Notwithstanding, the Food Basket Approach Can Help Policymakers Target Assistance
The food basket approach has its limitations. Consumption levels are held constant across time, so it is not possible to account for substitution in response to price or income changes. Because of data limitations, accounting for seasonal variations in monthly income or consumption is not possible. Available price data are also limited, and some of the price data used to calculate the food basket costs may be less than reliable. Additionally, because the food baskets are based on estimated household calorie shares, they represent actual consumption but do not necessarily provide the full range of nutrients required for a healthy diet.
Limitations notwithstanding, results of this analysis can help better pinpoint Tanzanian regions that may be more vulnerable to food insecurity. In the Lake Zone, the cost of the food basket is higher because of generally higher food prices, and the average income is lower than their respective counterparts in the Southern Highlands.
Furthermore, knowing the monthly costs for a representative food basket across the country can help identify vulnerable households and appropriate resources for poverty alleviation programs. One such example is a recently launched pilot program of conditional cash transfers to vulnerable households (conditions include enrollment of children in school, regular health checkups, participation in nutrition workshops, etc.), combined with “labor-intensive public works.”
This article is drawn from:
- Cochrane, N. & D'Souza, A. (2015). Measuring Access to Food in Tanzania: A Food Basket Approach. U.S. Department of Agriculture, Economic Research Service. EIB-135.
You may also like:
- Rosen, S., Meade, B., Fuglie, K. & Rada, N. (2014). International Food Security Assessment, 2014-24. U.S. Department of Agriculture, Economic Research Service. GFA-25.