
New Data on U.S. Food-Away-From-Home Prices Show Geographic and Time Variation
- by Aylin Kumcu and Abigail Okrent
- 9/8/2014
With close to one-third of Americans’ calories eaten away from home and substantial variation in nutritional value across food-away-from-home (FAFH) meals, understanding how prices drive demand for FAFH over time and across geographic areas may provide insight into consumer food choices and related health outcomes. Several studies have investigated the role of grocery store prices on food purchasing behavior and dietary outcomes, but conducting similar analyses for FAFH has been limited due to lack of detailed price data. To fill this gap, ERS developed the Quarterly Food-Away-From-Home Prices (QFAFHP) data to enable analysis of food demand and economic factors that determine diet quality and health outcomes.
ERS researchers used prices (without tax) collected by the U.S. Bureau of Labor Statistics for the Consumer Price Index (CPI) to construct quarterly average prices for 20 FAFH meals, food items, and beverages at 4 types of eating places: full-service restaurants (e.g., wait staff take customers’ orders and payment is made after eating), limited-service restaurants (e.g., customers pay at register before eating), vending machines, and schools. For alcoholic beverages, QFAFHP also includes at-home prices from grocery stores and liquor stores because of limited public information on alcohol prices. The data span the first quarter of 1998 to the second quarter of 2012 and are available at the national, census region, and census division levels. These ERS-constructed average prices do not represent official U.S. Bureau of Labor Statistics estimates.
QFAFHP Allows Researchers to Compare Prices Across Geographic Areas…
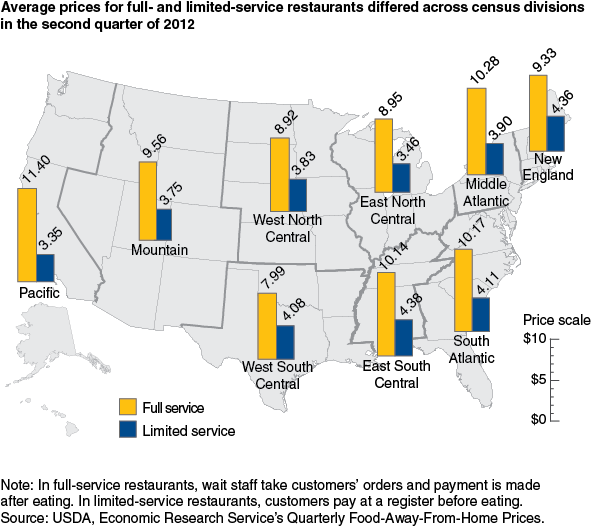
In the second quarter of 2012, meals at U.S. full-service restaurants cost $9.95 on average, while they cost $3.76 at limited-service restaurants; however, prices varied across census divisions. The Pacific census division had the highest priced full-service meals at $11.40 while the West South Central division had the lowest priced full-service meals at $7.99, a 43-percent difference. Limited-service meals in East South Central, which is the most expensive division for such meals, cost 31 percent more than those in the least-expensive Pacific.
… and by Types of Limited-Service Meals Over Time
In the second quarter of 2012, the average price for a limited-service entree or combination meal was $3.76, but prices varied by item and over time. Across the Nation, limited-service sandwiches were the most expensive ($6.08), followed by hamburgers and fried chicken. Pizza and Mexican-style meals were the least expensive. Annual price-growth rates also differed, with price growth increasing during the recession and declining post-recession for all but Mexican-style meals.
| Limited-service meals | Average price ($) 1998 quarter 1 |
Average price ($) 2007 quarter 4 |
Average price ($) 2009 quarter 2 |
Average price ($) 2012 quarter 2 |
Average annual growth (%) Pre-Recession |
Average annual growth (%) Recession |
Average annual growth (%) Post-Recession |
|---|---|---|---|---|---|---|---|
| Hamburgers | 2.98 | 4.07 | 4.56 | 5.03 | 3 | 8 | 3 |
| Sandwiches | 3.73 | 5.31 | 5.77 | 6.08 | 4 | 6 | 2 |
| Fried chicken | 3.18 | 4.36 | 4.65 | 4.71 | 3 | 4 | 0 |
| Pizza | 2.92 | 3.28 | 3.57 | 4.15 | 1 | 7 | 6 |
| Mexican | 1.74 | 2.58 | 2.73 | 3.53 | 6 | 4 | 10 |
| Note: Pre-Recession = 1998 quarter 1 – 2007 quarter 3. Recession = 2007 quarter 4 – 2009 quarter 2. Post-Recession = 2009 quarter 3 – 2012 quarter 2. Source: USDA, Economic Research Service, Quarterly Food-Away-from-Home Prices. |
|||||||
QFAFHP Has Price Data for School Lunches…
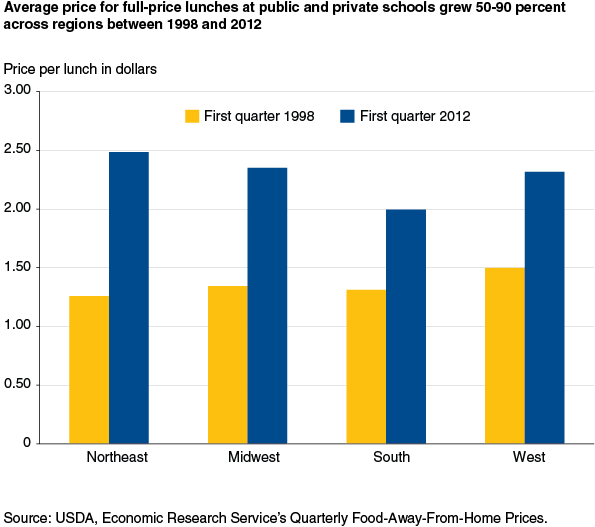
QFAFHP contains prices paid by students for full-price lunches averaged across U.S. public and private schools, kindergarten through 12th grade. In the first quarter of 2012, school lunches cost an average of $2.19, up 60 percent from $1.37 in the first quarter of 1998, but prices and increases varied by region and over time. In the first quarter of 1998, lunches were most expensive in the West ($1.50 per lunch), but by first quarter 2012, they were most expensive in the Northeast ($2.48). The Northeast had the largest increase over this period (97 percent), while the South had the least (52 percent). These increases outpaced regional inflation for overall FAFH as measured by the CPI, which showed increases of 47-49 percent from 1998 to 2012.
… and Allows Comparisons of the At Home and Away From Home Markets
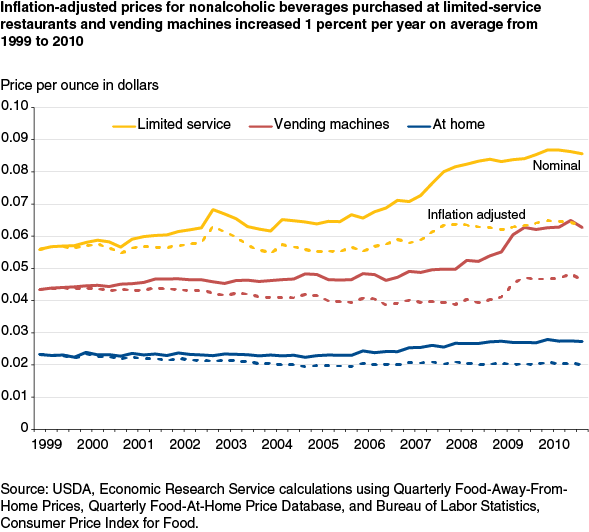
Researchers can paint a more complete picture of the food environment by linking QFAFHP with other data. Pairing QFAFHP with ERS’s Quarterly Food-at-Home Price Database, ERS researchers observed that foods and beverages away from home are generally more expensive than at-home versions. In the last quarter of 2010, nonalcoholic beverages purchased at limited-service restaurants cost $0.09 per ounce, or $1.37 for a 16-ounce serving, while beverages purchased at vending machines cost almost three-quarters of this price ($0.07 per ounce or $1.00 for 16 ounces). Beverages purchased in food stores cost even less, about one-third of the price of vending machine beverages ($0.03 per ounce or $0.44 for 16 ounces).
Adjusting these data for inflation using the all-food CPI shows inflation-adjusted prices grew slowly over time, and some beverages even experienced price declines. From 1999 to 2010, inflation-adjusted beverage prices grew only 1 percent per year on average at limited-service restaurants and vending machines, while they declined 1 percent at food stores.
By providing prices for food and beverages away from home by eating place and product type, QFAFHP can facilitate research on the role of away-from-home food and beverage prices on Americans’ food choices and diet quality.
This article is drawn from:
- Quarterly Food-Away-From-Home Prices. (n.d.). U.S. Department of Agriculture, Economic Research Service.
- Food-at-Home Monthly Area Prices. (n.d.). U.S. Department of Agriculture, Economic Research Service.