
What Happened to the “'Creative Class' Job Growth Engine” During the Recession and Recovery?
- by Tim Wojan
- 10/6/2014
The severity of the 2007/09 economic recession and the subsequent slow rural recovery (see “Rural Employment in Recession and Recovery” in this issue) have heightened interest in the concept of economic resilience: the ability of a local economy to bounce back from declines in employment, earnings, and output. Even if the business cycle makes recessions inevitable, the hardship caused by economic contractions can be reduced if local economies can reallocate resources from declining or stagnant economic sectors to growing sectors. One human capital resource that may facilitate this flexibility is the share of local employment in the “creative class”—those in occupations that specialize in the task of combining knowledge and ideas in novel ways, such as engineers, scientists, various management professionals, and artists, among others. While the share of employment in creative occupations was strongly associated with employment growth and economic dynamism in the 1990s in both rural and urban areas, results in the 2000s are not so clear cut.
The notion that urban development depends on novel combinations of knowledge and ideas with certain occupations specializing in this task, that people in these occupations are drawn to areas providing a high quality of life, and that the essential economic development strategy is to create an environment that attracts and retains these workers was first popularized by Richard Florida in Rise of the Creative Class. Although the concept was developed with urban areas in mind, ERS researchers found that the interaction of the environment for entrepreneurship with the share of the local workforce employed in creative occupations was strongly associated with growth in the number of new rural establishments and employment in the 1990s, particularly in those rural counties endowed with attractive outdoor amenities such as mountains, lakes, and agreeable climate. The 2007/09 recession has at least temporarily disrupted the strong historical relationship between rural natural amenities and economic growth. Has it had the same effect on the creative class’ ability to generate rural jobs?
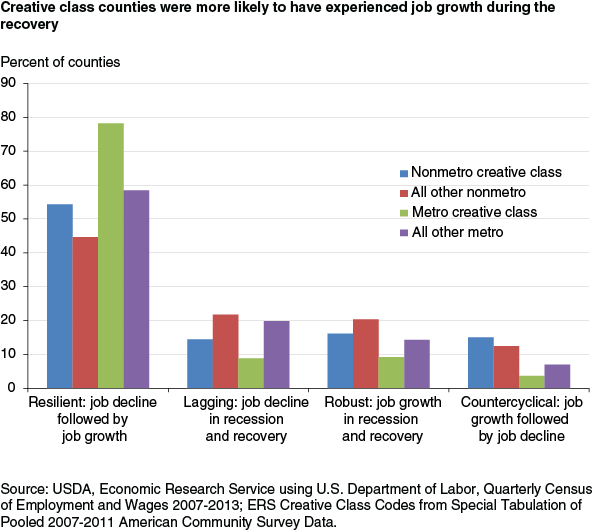
Using the ERS Creative Class County Codes, recently updated with pooled data from the Census Bureau’s 2007-11 American Community Survey, this article examines the economic resilience of counties with high shares of creative class workers relative to other counties. Administrative data from the U.S. Department of Labor, Quarterly Census of Employment and Wages (QCEW) provide monthly employment levels for all U.S. counties. Compiled from monthly unemployment insurance contributions, QCEW does not include self-employed individuals and other employees not covered by unemployment insurance, but nationally, QCEW captures 96 percent of total employment. Using QCEW data, the economic outcomes of U.S. counties in recession and recovery are classified into four mutually exclusive groups:
- Resilient counties are defined as those that experienced employment declines between December 2007 and June 2009 and employment increases since July 2009 (through September 2013, latest available data from QCEW);
- Lagging counties are defined as those that experienced employment declines during the recession and further employment declines since July 2009;
- Robust counties are defined as those that experienced employment growth during both the recession and the recovery; and
- Countercyclical counties are defined as those that experienced employment growth during the recession and employment declines during the recovery.
Creative class counties are defined as the 25 percent of counties with the highest creative class employment shares. However, to guard against possible misclassification of small rural counties due to sampling error, creative class counties must pass two screens: (1) be ranked in the top 25 percent based on the ERS creative class employment estimate, and (2) be ranked in the top 25 percent based on the creative class estimate minus its margin of error. Based on the updated ERS creative class employment estimates, 217 nonmetropolitan counties (10.6 percent of all “rural” counties, as defined by OMB in 2003) and 568 metropolitan counties (52.2 percent of all “urban” counties) were classified as creative class counties using this definition.
Creative class counties were more likely to be classified as resilient than their non-creative class peers. That is, a higher share of creative class counties gained employment in recovery after losing employment in recession. However, the percentage of metro counties classified as resilient was higher than the percentage of nonmetro counties, irrespective of creative class status. About 30 percent of nonmetro creative class counties had not seen employment growth in recovery, while less than 15 percent of metro creative class counties lost employment during the economic recovery. The one bright spot for nonmetro performance relative to metro areas is the higher percentage of counties that experience growth in both recession and recovery, driven mainly by the energy boom.
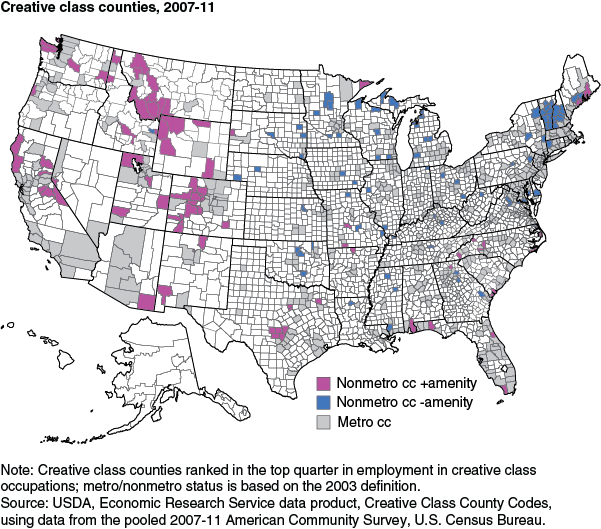
One possible explanation for nonmetro creative class counties not matching their urban peers is the much more important role that natural amenities and scenic beauty traditionally played in location decisions of the rural creative class. The map below shows the majority of counties classified as creative are high natural-amenity counties. Nonmetro creative class counties not classified as amenity counties are typically the outer ring of counties in large metro area commuting sheds or State capitals, or they contain a large college or university population. The map below identifies the location of metro and nonmetro creative class counties and further breaks out nonmetro creative class counties by amenity status.
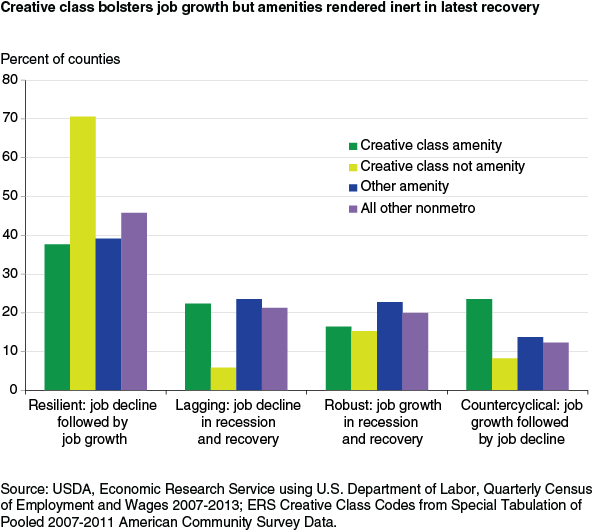
Despite a record of natural amenities contributing to growth prior to the 2007/09 recession, this association has largely disappeared over the past 6 years. Returning to the typology of recession and recovery patterns, researchers found that nonmetro creative class amenity counties are least likely to be members of the resilient group relative to all other nonmetro counties. The comparison with creative class counties that are not amenity counties is particularly striking. The recession and recovery patterns of creative class counties that are not amenity counties are much closer to the metro creative class county patterns, possibly because many of these counties are part of metro commuting sheds. For the amenity creative class counties, the added human capital endowment provided by workers engaged in skilled, creative activities does not appear to have hastened job growth in recovery.
This article is drawn from:
- Creative Class County Codes. (n.d.). U.S. Department of Agriculture, Economic Research Service.
You may also like:
- “The Rural Growth Trifecta: Outdoor Amenities, Creative Class and Entrepreneurial Context”. (2011). in Journal of Economic Geography, Vol. 11, No. 3.