
Poverty and Deep Poverty Increasing in Rural America
- by Tracey Farrigan
- 3/4/2014
The 2007-2009 recession and subsequent slow recovery have resulted in substantial increases in poverty, especially among children. Data available in the March Supplement of the Current Population Survey (CPS) and the American Community Survey (ACS) allow us to view the rise in poverty from multiple perspectives, including the total number of people living in poverty and deep poverty (those with incomes less than half of the poverty threshold), as well as the geographic distribution of poverty.
The CPS, sponsored jointly by the U.S. Census Bureau and the U.S. Bureau of Labor Statistics, is a monthly sample survey of about 60,000 households. It is designed specifically to produce current monthly employment and unemployment statistics and the annual data on income and poverty for the Nation. It is ideal for tracking changes in the poverty population over time. The ACS was developed by the Census Bureau to replace the long form of the decennial census. It uses a rolling sample of housing units (250,000 monthly) to provide basic population characteristics annually for areas with populations of 65,000 or more. ACS accumulates samples over 3- and 5-year intervals to produce estimates for areas with smaller populations. We use the 5-year averages to examine county-level poverty.
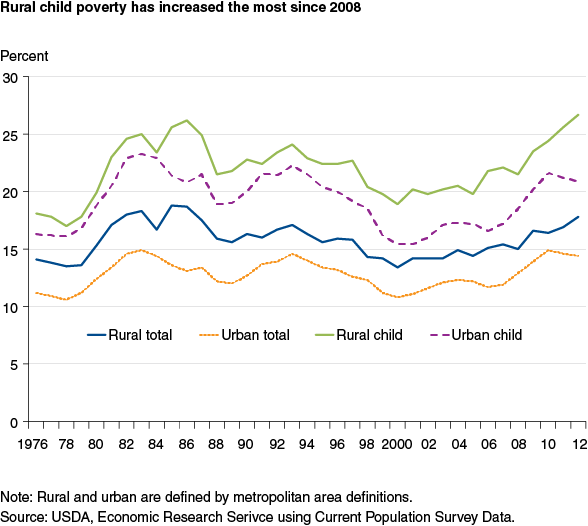
Examining poverty over time shows that the recent economic recession has resulted in the highest rural poverty rates since the mid-1980s, another period when an economic recession and slow rural recovery resulted in rising rural poverty rates long after urban poverty rates began declining. One important indicator of the Nation’s long-term well-being is poverty among children, since child poverty often has an impact that carries throughout a lifetime, particularly if the child lived in poverty at an early age. As with the early 1980s recession, rural children have been disproportionately affected by the recent economic downturn. Child poverty is more sensitive to labor market conditions than overall poverty, as children depend on the earnings of their parents. Older empty nesters and retirees are less affected by job downturns, and families with children need higher incomes to stay above the poverty line than singles or those married without children.
Incidence of poverty
In the United States, being in poverty is officially defined as having an income below a federally determined poverty threshold. Poverty thresholds were developed in the 1960s and are adjusted annually to account for inflation. They represent the Federal Government’s estimate of the point below which a family of a given size has cash income insufficient to meet basic needs. The thresholds form the basis for calculating the 'incidence of poverty,' which is typically reported as a headcount or as a percentage of the population. In 2012, 15 percent of the Nation’s population lived in poverty, and poverty rates were higher in rural than in urban areas both among the overall population and among children. In 2012, both overall rural poverty (17.8 percent) and rural child poverty (26.7 percent) were near their previous 1986 peaks. The urban peak in the 1980s was reached in 1983, marking the faster urban recovery following the 1980-81 recessions, and urban poverty rates have recently declined from their 2010 (14.9 percent) peak. It is too early to tell if 2012 will mark the high point in rural poverty rates following the 2007-09 recession.
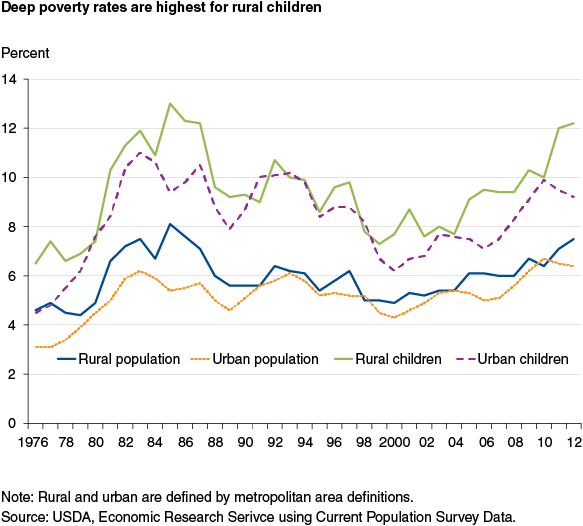
Incidence of deep poverty
'Deep poverty' is commonly defined as having cash income below half of one’s poverty threshold. In 2012, that meant a subsistence level of less than $1,000 a month for a family of four. A total of 6.6 percent of the U.S. population experienced deep poverty in 2012. Unlike trends in the official poverty statistics, there is not a pronounced and consistent rural-urban gap in the share of the population experiencing deep poverty over time. Nonetheless, the slow rate of the economic recovery in rural areas following the recent recession is evident in the deep poverty trends, just as it was following the 1980-81 recessions. As with overall poverty, deep poverty among children is more acute in rural areas (12.2 percent) than in urban areas (9.2 percent). Not only are deep poverty rates among children higher than those for the overall population, but children have experienced higher rates of growth in deep poverty over the last decade, particularly in rural areas. While the 2012 rural/urban gaps in both total and deep poverty are not as large as they were in the 1980s, estimates indicate that, with child poverty increasing in rural areas in 2010-2012 and urban child poverty declining, rural/urban gaps in child poverty may yet reach their mid-1980s levels.
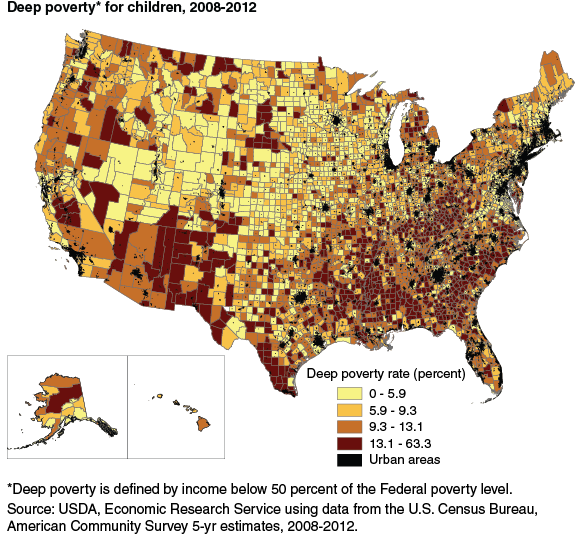
Geography of deep poverty
The ACS serves as an important source of data on the location of the deep poverty population. The highest rates of deep poverty among children are in rural areas of the Southwest and the North Central Midwest, on Native American lands, and in historically poor regions of the rural Southeast, while the lowest rates are in the Northeast. This geographic pattern holds true for deep poverty among the total population as well. In the 1980s, deep poverty was clustered largely in the Southeast, particularly in Mississippi, Arkansas, Alabama, and Virginia. The South is still home to much of the Nation’s most severe poverty, but impoverishment has grown across the Midwest, Southwest, and Pacific, as well as in the Northeast, even though Northeastern rates remain relatively low. Deindustrialization contributed to the spread of poverty in the Midwest and the Northeast, while the Southeast made some economic progress, in part by attracting manufacturing jobs. Another factor was rapid growth in Hispanic populations, which tend to be poorer, particularly in California, Nevada, Arizona, Colorado, North Carolina, and Georgia.
This article is drawn from:
- Rural Poverty & Well-Being. (n.d.). U.S. Department of Agriculture, Economic Research Service.
You may also like:
- Oliveira, V., Tiehen, L. & Ver Ploeg, M. (2014, February 3). USDA’s Food Assistance Programs: Legacies of the War on Poverty. Amber Waves, U.S. Department of Agriculture, Economic Research Service.