
Crop Outlook Reflects Near-Term Prices and Longer Term Market Trends
- by Mark Jekanowski and Gary Vocke
- 5/20/2013
Highlights
- U.S. corn and wheat acreage is expected to increase in 2013, soybean acreage is expected to stay mostly unchanged, and rice and cotton acreage will likely decline.
- Corn and soybean acreage has expanded considerably since the mid-2000s; driven by strong profitability and genetic innovations that support expansion of both crops in nontraditional areas such as the Northern Plains.
- The acreage shifts in recent years reflect strengthening domestic and foreign demand for U.S. corn and soybeans and increased global competition in wheat, cotton, and other commodity markets.
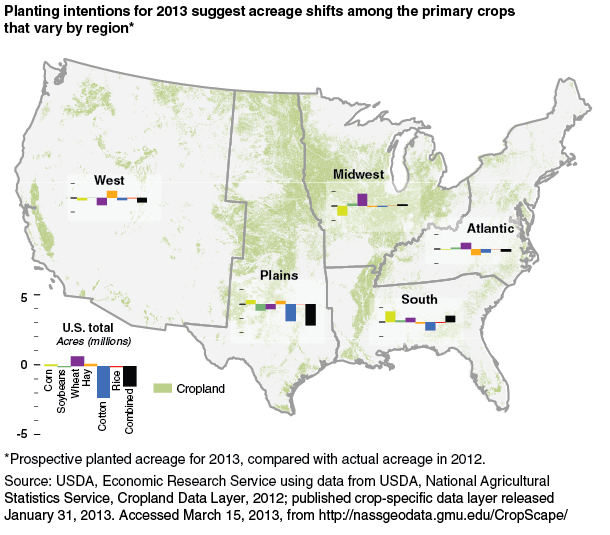
USDA released its initial scenarios on the U.S. crop outlook for 2013/14 in February during the Agricultural Outlook Forum (www.usda.gov/oce/forum/). On March 28, USDA’s National Agricultural Statistics Service (NASS) released its Prospective Plantings report, providing a first glimpse of acreage decisions for more than 20 different commodities based on a nationwide survey of farmers. These initial indications suggest a continuation of recent trends toward expansion of corn and soybean acres at the expense of rice and cotton. A number of world market developments lie behind this shift, including the expansion of U.S. ethanol production, rising demand in China for U.S. soybeans, and new competition for U.S. wheat producers from Black Sea wheat exporters. Actual plantings may diverge from producer intentions, but these broader world market developments are expected to continue to shape planting decisions of U.S. farmers.
2012 Recap: Promising Planting Season Gives Way to Drought-Reduced Yields
The market conditions for agricultural commodities in 2013 are the result of planting decisions made by farmers in spring 2012 and growing conditions experienced throughout summer 2012. The 2012 planting season got off to a strong start, as warm, dry weather during an early spring allowed planting, especially of corn, to proceed at a record pace across much of the Nation. Area planted to corn increased nearly 6 percent over the previous year to 97.2 million acres, while soybean area rose to 77.2 million acres, the third highest amount ever and only 253,000 acres below the record high in 2009.
But conditions worsened over the summer, as drought severely stressed corn, forage, and other crops. Corn yields at harvest were only 123.4 bushels per acre, the lowest since 1995 and 25 percent below initial forecasts. Hay production in 2012 fell to its lowest level since 1964 and was 9 percent below the drought-reduced harvest in 2011. The decline in soybean yields was more modest as late-season rains helped many of the drought-stressed fields recover somewhat prior to harvest. Still, the average yield of 39.6 bushels per acre was 10 percent below initial expectations and 5 percent below 2011 levels.
2013 Outlook: Corn and Soybean Plantings Continue To Expand at the Expense of Cotton and Rice
The 2013/14 outlook for U.S. grains and oilseeds anticipates another year of large plantings supported by strong new-crop prices and correspondingly favorable revenue protection under crop insurance. As is customary so early in the growing season, the outlook assumes normal weather patterns that will support crop yields at or near levels consistent with long-term trends. Thus, planted area is the critical factor driving the early outlook for each commodity, particularly how farmers allocate their acreage across different crops and competing uses.
Based on the Prospective Plantings report, area planted to the three largest crops (corn, soybeans, and wheat) will be 231 million acres in 2013, up slightly from 230 million acres in 2012. The three-crop total in 2012 was the highest since 1982, when wheat accounted for the largest share of planted area. Corn now accounts for the largest share of area and soybeans rank second. If prospective plantings are realized, corn acreage will be the highest since 1936 and soybeans acreage will be the fourth highest on record.
Total planted area for the eight largest U.S. crops (corn, soybeans, and wheat along with sorghum, barley, rice, oats, and cotton) is expected to be 257.6 million acres in 2013, nearly identical to the total in 2012 (257.7 million), the highest amount in 15 years. Planting intentions for 2013 suggest some notable shifts in acreage among these eight crops year over year: a 2.3-million acre (18.6 percent) decline in cotton area; a 1.4-million acre (22 percent) increase in sorghum area; and a 3-percent decline in rice area that would result in the smallest planted acreage since 1987.
Corn and Soybean Plantings To Remain High
Prospective corn plantings in the U.S. for 2013 are 97.3 million acres. If realized, planted area for corn would be up for the fifth consecutive year and 0.1 million acres above the 75-year high reached in 2012. Strong prices in both the futures and cash forward markets support a favorable outlook for the profitability of corn.
Corn acreage is shifting toward nontraditional regions of the United States. Many Southern States, such as Arkansas, Mississippi, and Texas, are shifting acreage out of cotton and rice into corn (as well as into soybeans). Other States expected to expand corn acreage this year include North Dakota, Arizona, Idaho, and Minnesota. At the same time, acreage in the Midwest is expected to drop slightly in 2013, with the largest declines in Illinois, Indiana, and Missouri.
Prospective soybean planted area in the U.S. is 77.1 million acres in 2013, down 0.1 million acres from 2012 but still the fourth-highest on record. High soybean futures prices and current forward-pricing opportunities are providing strong incentives for planting soybeans. In many States hit hardest by the drought in 2012, soybean yields held up relatively well compared with corn, so soybean area is expected to increase in areas such as the Eastern Corn Belt, where farmers might see soybeans as a less risky alternative to corn. Soybeans are also expected to replace cotton and rice in parts of the Mississippi Delta, and soybean planted area could be the largest on record in New York, North Dakota, and Pennsylvania.
U.S. wheat planted area for 2013 is up 0.7 million acres to an estimated 56.4 million acres. Winter wheat seeded area at 42.0 million acres is up 0.7 million from 2012, including the large increase in winter wheat seedings in the Midwest (mentioned above). Favorable new-crop wheat prices in fall 2012 increased plantings of winter wheat, except in parts of the Central and Southern Plains plagued by extreme drought. Prospective spring wheat (including durum) plantings for 2013 are up marginally from 2012 to 14.5 million acres. Lower durum seedings mostly offset increases for other spring wheat as farmers responded to relatively low durum prices.
Weaker Prospects Seen for Other Field Crops
Prospective rice planted acreage for 2013 is 2.61 million acres, down 0.09 million acres (3 percent) from 2012. The majority of this year’s acreage decline occurs in long-grain rice in the Delta States, where producers are expected to switch to crops that earn a higher, less risky return, such as corn and soybeans. Area planted to rice in Arkansas, the largest rice-producing State, is 5 percent below that of 2012. In Mississippi, growers intend to plant 8 percent fewer acres to rice in 2013 than in 2012. In Texas, where drought conditions persist, planted area is expected to be record low.
Prospective cotton planted acreage in the U.S. is 10.0 million acres in 2013, a decrease of 2.3 million acres (nearly 19 percent) from 2012, due mainly to lower cotton prices and relative net returns that favor shifts to alternative crops. Cotton is being replaced by wheat, corn, and soybeans in the South and wheat, sorghum, and specialty crops in the Southwest.
Changing Domestic and International Demand Drive Shifts in Acreage
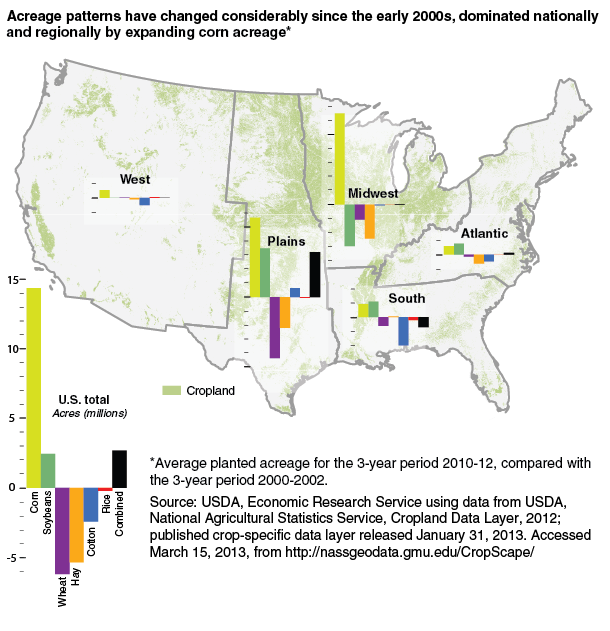
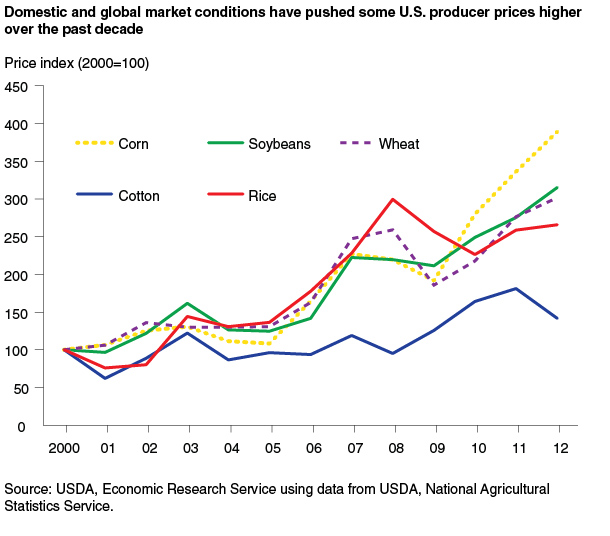
The acreage shifts in recent years are the result of changes in domestic and international demand that have influenced the relative prices of corn, soybeans, wheat, and other commodities. In the domestic market, U.S. ethanol policy has greatly expanded demand for corn. In the international market, China’s rapidly increasing soybean imports have boosted the demand for U.S. soybeans. At the same time, U.S. wheat is facing increased foreign competition led by the rise of low-cost wheat exports from the Black Sea region. U.S. cotton and rice are also dependent on world demand for their market. At the same time, genetic improvements in corn and soybeans have expanded opportunities to produce these crops in drier and more northern regions traditionally limited to wheat or other grains.
Biofuel Demand Favors Corn Production
The biofuel use mandate established in 2005 and the expansion of the Renewable Fuel Standard in the Energy Independence and Security Act of 2007 have given rise to rapid growth in U.S. ethanol production and demand for corn, the primary ethanol feedstock in the United States. Roughly 40 percent of the U.S. corn crop has been used in the production of ethanol in recent years. U.S. biodiesel production has also risen, with soybean oil being a primary feedstock.
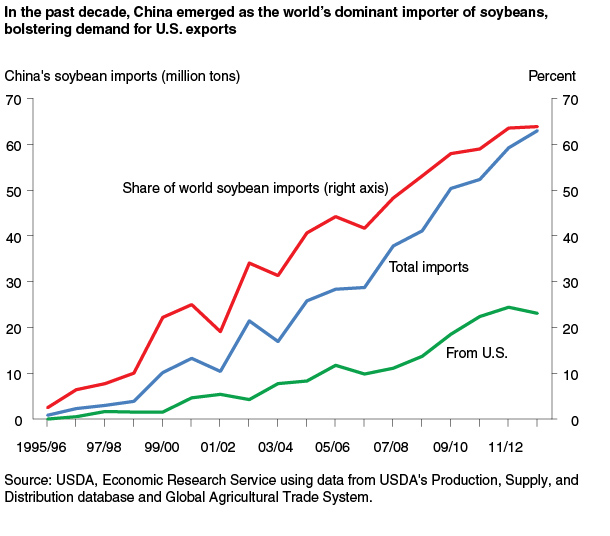
China Imports Boost Demand for U.S. Soybeans
Rising incomes in China have led to a major shift in Chinese diets to include more livestock products. This dietary change has supported remarkable growth of soybean imports following some policy changes beginning in the 1980s and early 1990s, when Chinese leaders developed strategic plans intended to spur the growth of an industrialized feed industry and modern livestock production. Prior to these changes, shortages of protein sources for feed in China were a continuing problem.
China’s accession to the World Trade Organization (WTO) in 2001 led to a surge of foreign investment in the Chinese soybean processing industry and an expansion of crushing capacity that far exceeded the country’s domestic soybean production levels. Import quotas for raw soybeans were eliminated prior to WTO accession, facilitating the import of soybeans from world suppliers, including the United States.
Chinese soybean production has been declining for some time in favor of corn and rice production. The bulk of soybeans produced in China are for human consumption, while soybeans from the United States and South America, China’s two primary import sources, are crushed for feed and commercial oil uses. China has more than a 60-percent share of global soybean imports.
Black Sea Exports Compete With U.S. Wheat
The number of major wheat-exporting countries has expanded in recent years from the traditional exporters of the United States, Argentina, Australia, Canada, and the European Union to include Ukraine, Russia, and Kazakhstan. These three Black Sea exporters together surpassed U.S. wheat shipments in 2009/10 and again in 2011/12 by 11.6 million metric tons (mmt) and 10.1 mmt, respectively. During the mid-1990s, their combined wheat exports were less than 5 mmt.
Relatively low production costs, lower risks compared with alternative crops due to the relative hardiness and lower input costs of wheat, and proximity to important markets—particularly Egypt—have been key factors in the expansion of Black Sea wheat production and exports. However, the region’s wheat exports are also highly variable because of frequent weather events, such as freezes and droughts. In 2008, 2009, and 2011, Black Sea exporters produced about 100 million metric tons (mmt) of wheat annually. In 2010, drought reduced their output by 68 mmt. With a return of adverse weather conditions in 2012, production is estimated at only 63 mmt. But, despite the region’s highly variable weather, its share of world wheat trade continues to rise as a result of low production costs and new agricultural investments.
With growing competition from Ukraine, Russia, and Kazakhstan, as well as more traditional exporting countries, the U.S. share in world wheat exports has fallen from 45 percent in 1980/81 to an average of about 20 percent in the last 4 years. However, future growth in wheat exports by Russia is likely to be slower, as more wheat there is expected to be used domestically to supply the expanding livestock sector.
U.S. Cotton and Rice Area Is Highly Dependent on Export Demand
The longer term story for U.S. cotton has been the shift toward export dependency. Domestic demand for cotton has declined since the late 1990s as spinning capacity shifted to developing countries. In addition, the introduction of full planting flexibility in the 1996 Farm Act facilitated the production of corn, soybeans, and other crops on land previously devoted to cotton. Finally, with the elimination of textile and apparel quotas in 2005 under the WTO’s Multi-Fiber Arrangement, domestic demand for raw cotton fell even further as textile production became more competitive overseas. With the rise of new competitors, cotton prices trended lower relative to other major crops and U.S. planted area declined, falling from nearly 17 million acres—or 22 percent of global cotton area—in 1995 to 9.1 million—or 11 percent of global cotton area—2009. Since then, however, strong export demand, especially from China, has boosted world prices. The result has been a recovery in U.S. planted area in recent years, which reached 14.7 million acres in 2011 before again trending lower to the 10 million acres expected to be planted in spring 2013.
The U.S. typically exports about half of its rice crop each year, making this market strongly dependent on global supply-and-demand conditions. With just 1.5 percent of global production, the U.S. has little effect on global markets while production and policy decisions made by other countries can have a large effect on the prices received by U.S. farmers. While rice prices are high compared with those of a decade ago, production costs are also high relative to crops such as corn and soybeans and have increased due to rising costs for both water and fuel required for irrigation. U.S. acreage has thus been trending lower for some time as some farmers view corn or soybeans as offering better returns with lower price risk.
Prospective Acreage Can Still Differ Widely From Actual Plantings
The Prospective Plantings report for 2013 suggests that the U.S. could see the largest corn acreage since 1936 and the fourth highest soybean acreage on record, along with a sharp decline in cotton acreage and a modest decline in rice. But these estimates are based on a survey of farmers conducted during the first 2 weeks of March 2013, long before most farmers have begun field work or finalized their planting decisions. Changing market conditions or unexpected weather developments that can affect planting conditions can cause actual plantings to diverge—sometimes sharply—from prospective estimates. Nevertheless, the market developments that have reshaped agricultural markets over the past decade will continue to drive planting decisions in 2013, and the resulting supply-and-demand balance for each of these crops will determine the prices farmers are likely to see at harvest.
The following ERS analysts also contributed to this article: Mark Ash (oilseeds), Tom Capehart (feedgrains), Nathan Childs (rice), and Leslie Meyer (cotton).
This article is drawn from:
- Capehart, T., Allen, E. & Bond, J.K. (2013). Feed Outlook: May 2013. U.S. Department of Agriculture, Economic Research Service. FDS-13E.
- Vocke, G. & Liefert, O. (2013). Wheat Outlook: May 2013. U.S. Department of Agriculture, Economic Research Service. WHS-13E.
- Ash, M. (2013). Oil Crops Outlook: May 2013. U.S. Department of Agriculture, Economic Research Service. OCS-13E.
- Meyer, L., MacDonald, S. & Kiawu , J. (2013). Cotton and Wool Outlook: May 2013. U.S. Department of Agriculture, Economic Research Service. CWS-13E.
- Childs, N. (2013). Rice Outlook: May 2013. U.S. Department of Agriculture, Economic Research Service. RCS-13E.