
Obesity and Other Health Concerns Lead Food Companies To Step Up Health and Nutrient Claims
- by Stephen Martinez
- 7/1/2013
Highlights
- After falling during the 1990s, the percentage of new food and beverage products making voluntary health- and nutrition-related claims began rising in 2002.
- In 2010, 43 percent of new foods and beverages claimed to be low in fat, high in fiber, or formulated with some other positive nutrition or health attribute.
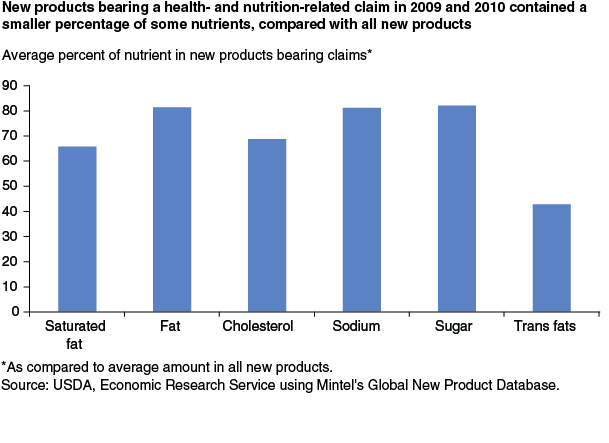
- New products bearing a health- and nutrition-related claim contained smaller quantities, on average, of six nutrients that Americans are advised to eat less of, such as sodium and added sugars, compared with all new products.
With tens of thousands of different foods and beverages available to U.S. food shoppers, companies compete for customers through a variety of means—pricing strategies, advertising, shelf placement, coupons, and more. Food companies also seek to woo shoppers by including voluntary health- and nutrition-related (HNR) claims on their products. Companies hope claims such as “low fat,” “sodium free,” and 'contains 32 mg of omega-3 fatty acids per serving' will not only provide consumers with information about their products but differentiate them from their competitors’ products and boost sales.
A recent ERS analysis found that between 25 and 44 percent of new food and beverage products carried at least one HNR claim on an annual basis from 1989 to 2010. However, use of the claims displayed divergent trends over the period. From 1989 to 2001, the percentage of new products with at least one HNR claim trended downward, from 34.6 percent in 1989 to 25.2 percent in 2001. After 2001, this percentage showed a marked reversal, increasing to 43.1 percent in 2010. A deeper examination of the number and types of HNR claims used on new products reveals how Government policies, new health and nutrition information, and changing consumer preferences can shape the types of nutrition information disclosed by food companies to promote their products.
Food Labeling Regulations Can Limit Nutrition and Health Claims. . .
In the early 1990s, Congress passed the most significant piece of food labeling legislation in recent history—the Nutrition Labeling and Education Act of 1990 (NLEA). This legislation established labeling regulations that require nearly all packaged products to carry the Nutrition Facts label. The regulations, which are implemented and interpreted by the U.S. Food and Drug Administration (FDA), also identify which voluntary HNR claims are allowed and under what circumstances they can be used. For example, “good source of fiber” may be used if the product contains 10 to 19 percent of the recommended daily intake of fiber per serving. FDA also established specific requirements for claims made about the health benefits of certain nutrients. Companies that make nutrient claims are required to highlight excessive levels of nutrients that Americans are advised to consume less of.
The objectives of the NLEA were to reduce consumer confusion about food labels and to help consumers make healthy food choices. The Act was intended to increase the reliability of HNR claims on labels by making it more difficult for food companies to make unsubstantiated claims. By increasing the credibility of positive product claims, the NLEA aimed to provide an incentive for manufacturers to produce healthier food choices.
ERS researchers used a database maintained by Datamonitor Group, a business information and market analysis company, to analyze trends in usage of HNR claims; the role of HNR claims as a way to compete for sales; and the effects of changes in the marketing environment, such as the provisions of the NLEA, on companies’ use of HNR claims. The Datamonitor database contains information about new food and beverage products introduced in the United States (see box, "What Is a 'New' Product?"). The downward trend in new products with HNR claims, from 34.6 percent of all new products in 1989 to 25.2 percent in 2001, suggests that implementation of the NLEA in 1993/94 may have restricted use of such claims. Manufacturers making HNR claims may have dropped them because the claims did not meet the newly detailed requirements. HNR claim usage may also have fallen because disclosure requirements made them more costly to implement or reduced their effectiveness.
In the post-NLEA environment, food companies seem more interested in promoting foods targeted for increased consumption, such as fruit and vegetables, than foods targeted for reduced consumption, such as oils and fats, desserts and ice cream, and snacks. From 1989 to 2001, the percentage of new products that carried HNR claims fell in 12 of 16 food categories. Oils and fats, including cooking spray, shortening, and frying oil, had by far the largest reduction, falling from 65.8 to 19.6 percent. Reductions in the other 11 categories were led by desserts and ice cream; fruits and vegetables, soups, baby food, and meals and entrees had relatively modest increases in HNR claims. Claims related to cholesterol, sodium/salt, calories, fiber/bran, and sugar/sweeteners on new products fell significantly over the 1989-2001 period.
| Category | Percent of new products with claims in 1989 | Percent of new products with claims in 2001 |
|---|---|---|
| Those with the largest reductions | ||
| Oils and fats | 65.8 | 19.6 |
| Desserts and ice cream | 38.9 | 24.5 |
| Meat, fish, and poultry | 42.0 | 28.0 |
| Bakery | 50.3 | 37.7 |
| Snacks | 43.9 | 32.5 |
| Those with any increase | ||
| Fruits and vegetables | 18.1 | 22.8 |
| Soups | 24.6 | 27.0 |
| Baby food | 9.5 | 11.4 |
| Meals and entrees | 13.0 | 14.5 |
| Source: USDA, Economic Research Service using the Datamonitor, Product Launch Analytics database. | ||
. . .Or Spark Increased Competition on Specific Nutrients
Labeling regulations may encourage product reformulation and claim use based on a newly recognized nutrient, as is the case with trans fats. Prior to the 1990s, there was little consensus from the scientific community on the harmful effects of trans fatty acids intake. However, in 2002, the Institute of Medicine of the National Academies concluded that any intake of trans fatty acids is associated with increased health risk. In 2003, FDA issued a regulation mandating disclosure for trans fatty acids, or trans fats, on nutrition labels by 2006. The importance of limiting trans fats was further communicated to consumers in a 2005 Dietary Guidelines for Americans recommendation: “Consume less than 10 percent of calories from saturated fatty acids and less than 300 mg/day of cholesterol and keep trans fatty acid consumption as low as possible.”
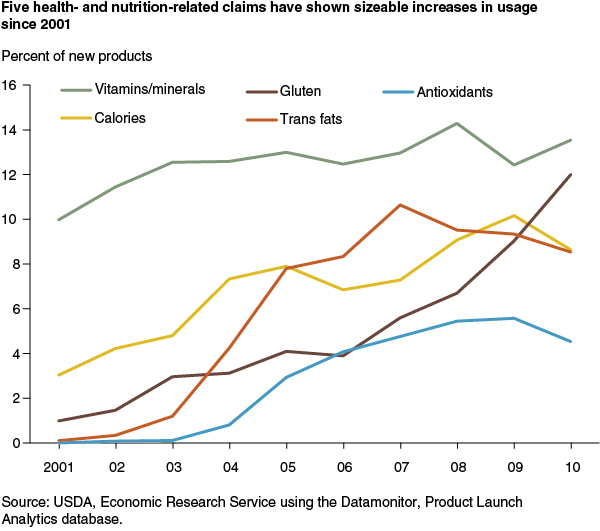
As food companies revised labels to meet the impending 2006 deadline, some also reformulated their products with new trans fats-free oils and used claims to gain a competitive edge. Prior to 2001, Datamonitor identified no products with low/no trans fats claims. From 2001 to 2005, the percentage of new products with no/low trans fats claims increased from 0.1 to 7.8 percent, which was the largest increase among HNR claims over the period. By 2010, low/no trans fats ranked as the fifth most popular claim, trailing only “high vitamins/minerals,” “no gluten,” “low/no fat,” and “low/no calories.” In this case, new food labeling regulations and nutrition education efforts made it easier for consumers to limit their trans fats intake. At the same time, food companies had a new platform for showcasing their products.
Food Companies Capitalize on New Health and Nutrition Information
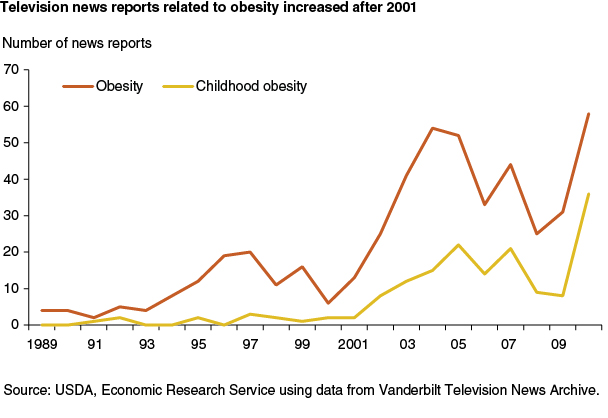
Coverage of obesity-related stories in television news broadcasts increased markedly after 2001, when obesity was labeled as an epidemic by the World Health Organization, the Centers for Disease Control and Prevention, and the U.S. Surgeon General. Topics ranged from the public cost of obesity-related health problems to food industry advertisements of sugary snacks targeted at children. In 2010, 36 of 58 network news reports about obesity focused on childhood obesity. Topics of these reports included a proposal to tax soft drinks to prevent childhood obesity and First Lady Michelle Obama's Let's Move campaign to fight childhood obesity. Over 2001-10, claims related to calories and sugar ranked among those HNR claims with the largest percentage-point increases.
Public nutrition education efforts, such as those that implement the Federal Dietary Guidelines for Americans, may also increase public awareness and understanding of diet and health linkages. Whole grains’ role in a healthy diet is one example. The 2000 Dietary Guidelines was the first edition of the Guidelines to recognize the unique benefits of whole grains, and the 2005 Dietary Guidelines recommended a specific amount of fiber-rich whole-grain products—3 or more ounce-equivalents of whole-grain products per day.
The introduction of the Whole Grains Council stamp in 2005 to strengthen the credibility of voluntary whole-grain labeling was also likely a force behind the rapid rise in whole-grain claims. To participate in the Whole Grain Stamp program, manufacturers must be members of the Whole Grains Council, file information about each qualifying product with the Council, and sign a legal agreement that they will abide by all requirements of the Stamp program. Such programs can improve consumers’ ability to identify nutritious foods. From 2005 to 2010, new products with whole-grain claims increased from 2.3 to 4.5 percent of all new products, which was the second biggest increase among HNR claims.
The 2000 and 2005 Dietary Guidelines also recognized the role of soft drinks and other sugar-sweetened beverages in the U.S. obesity problem and the need to limit calories from soft drinks. From 2001 to 2010, percentage of sugar-related claims carried by new beverage products accounted for the biggest increase in an HNR claim carried by a single product category, from 24 to 45 percent. In addition, the share of calorie claims accounted for by new beverages grew noticeably, from 34 to 40 percent.
New snacks and desserts and ice cream moved into the top five food categories with calorie-related claims in 2010, accounting for 8 and 6 percent of all calorie claims, respectively. The growing importance of new beverage and snack products with calorie-related claims is especially relevant given that snacks and beverages between meals account for a quarter of Americans’ calorie intake.
Taste Perceptions Trump Health Concerns for Some Nutrients
While Americans may be willing to forgo calories in their soft drinks and desserts, they seem less willing to embrace foods with lower fat and sodium levels. Mandatory nutrition labeling and consumer concerns about fat prompted food manufacturers to sell lower fat versions of high-fat foods and market them as “low/no” fat. New products with low/no fat claims grew from 9.2 percent in 1989 to over 25 percent in 1995 and 1996.
But many consumers found the taste of fat-free and low-fat foods introduced in the mid-1990s to be disappointing or unacceptable, which may have led companies to limit their use of low/no fat claims. From 1997 to 2000, the percentage of new products with low/no fat claims fell from 22 to 15 percent, and many companies reformulated their low/no fat products by adding some fat to improve taste. However, since 2001, increased attention to the obesity epidemic appears to have stemmed the downward spiral in products introduced with low/no fat claims.
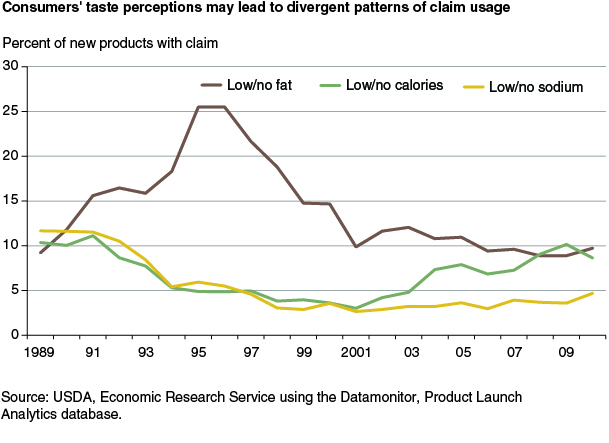
Food industry concerns that consumers associate poor taste with reduced-sodium foods may also have contributed to limited use of sodium claims. While sodium claims increased by 2 percentage points from 2001 to 2010, over half of the increase occurred in 2010. This may have been due to increased attention to the need to moderate sodium intake, including a report released by the Institute of Medicine in 2010 that recommended FDA set mandatory national standards for sodium in processed foods and menu items.
Many food companies remain wary of promoting reduced-sodium versions of their products. For example, in 2010, food science innovations enabled Frito-Lay to introduce its seasoned chips containing 25 percent less sodium by cutting topical salt and other ingredients, according to an industry trade magazine. The company chose not to advertise the reduction on its packages.
Claims Target Evolving Consumer Preferences for a Healthy Lifestyle
Food companies are adept at spotting new health and nutrition attributes on which to compete based on evolving consumer preferences. Claims related to gluten—a protein found in wheat, barley, and rye—antioxidants (e.g., vitamin E, vitamin C, beta carotene), and omega-3 fatty acids, which were used sparingly prior to 2001, ranked among the top 15 HNR claims by 2010. Products with these claims target consumers looking for foods that promote overall health. Baby boomers looking to slow the aging process and to prevent or manage chronic diseases, such as diabetes and cardiovascular disease, provide an attentive customer base for companies marketing foods that promote health.
The growth in gluten-free products illustrates the speed at which companies can respond to consumer dietary preferences. From 2001 to 2010, the percentage of new products with a “no gluten” claim increased from 1 to 12 percent, which was the largest percentage-point increase among HNR claims. This occurred despite the challenges presented in reformulating products for the gluten-free market in some food categories. By 2010, “no gluten” ranked second only to claims related to vitamins and minerals.
Some consumers purchase gluten-free products to control wheat allergy and celiac disease, which is an inherited autoimmune condition that can lead to malnutrition, osteoporosis, and other potentially fatal health problems. Other consumers perceive a gluten-free diet to be generally healthier, higher in quality, and more beneficial for managing weight than their regular diet.
Antioxidant- and omega-3-containing foods are promoted for their potential role in improving overall health by delaying the onset of many age-related diseases, preventing eye disease, reducing some cancer risks, and improving cardiovascular function. Products touted as high in antioxidants had the fourth largest percentage-point increase among HNR claims from 2001 to 2010, behind only no gluten, low/no trans fats, and low/no calories. The increase in omega-3-related claims ranked as the 10th largest increase over the same period.
Are New Products With Claims Really Healthier?
Food companies have incentives to focus on the positive attributes of their products and downplay the negative. This is particularly troublesome if consumers assume that products with HNR claims are more healthful with respect to nutrients not mentioned in the claim—the so-called halo effect—or associate unproven health benefits with the product. Some researchers, however, find that competition among companies can lead them to improve multiple nutritional attributes of their products and provide a more complete depiction of how they can contribute to a healthy diet.
Using nutritional information from Mintel’s (a market-research firm) Global New Product Database, ERS researchers compared the average nutritional content of products with HNR claims versus that of all new food products introduced in 2009 and 2010. Compared with the average contained in all new products, those carrying at least one of the leading HNR claims from 2010 contained smaller quantities per serving, on average, of six nutrients that should be consumed only in moderation. For example, new products with HNR claims contained less than 70 percent of the cholesterol—6.0 mg versus 8.8 mg—and 81 percent of the sodium—205.8 mg versus 253.4 mg—in all new products. The analysis suggests that companies did not use the claims to market products that are unhealthier with respect to these six nutrients, nor did companies compensate by adding unhealthy nutrients when they reformulated products to qualify for a HNR claim.
HNR claims on new products over time illustrate the influence that both Government policies and consumers can have on the behavior of firms and the information environment in which food choices are made. They also suggest that as food companies battle for market share, the health and nutritional features of their products are becoming an increasingly important component of their differentiation strategies.
This article is drawn from:
- Martinez, S. (2013). Introduction of New Food Products With Voluntary Health- and Nutrition-Related Claims, 1989-2010. U.S. Department of Agriculture, Economic Research Service. EIB-108.
- Rahkovsky, I., Martinez, S. & Kuchler, F. (2012). New Food Choices Free of Trans Fats Better Align U.S. Diets With Health Recommendations. U.S. Department of Agriculture, Economic Research Service. EIB-95.
You may also like:
- "Getting Consumers to Eat More Whole-Grains: The Role of Policy, Information, and Food Manufacturers". (2008). Food Policy, 33(6):489-496. by Lisa Mancino, Fred Kuchler, and Ephraim Leibtag.