
ERS Food Dollar Series Allows an Indepth Look at Farm Level Components of the U.S. Food Dollar
- by Patrick Canning
- 7/1/2013
Since the 1940s, ERS and its predecessor agency (Bureau of Agricultural Economics) have published a marketing bill series to meet the U.S. Congress’s mandate that USDA identify the “costs of marketing agricultural products in their various forms and through the various channels....” The marketing bill splits the food dollar into two parts: a farm share of every $1 spent on domestically produced food and a post-farm gate marketing share. Over time, the farm share varies in response to changes in commodity prices and costs for farm-level inputs; costs for marketing inputs such as packaging materials, fuel, and processing services; the types of foods Americans eat; and the frequency with which they eat out.
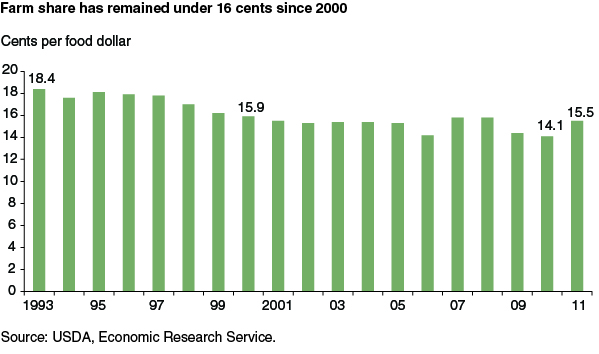
In 2011, ERS introduced an expanded data product, ERS’s Food Dollar Series, which includes a revamped marketing bill series that more fully represents today’s food production technologies and food spending patterns. The updated product also includes two additional series—the industry group series and the primary factor series—to provide further perspectives on farming and marketing costs. ERS revised the marketing bill series back to 1993. Since 1993, the farm share has mostly trended downward, beginning the period at 18.4 cents and remaining below 16 cents since 2000. In 2011, the farm share was 15.5 cents of the total food dollar (including grocery store purchases and eating out), up from 14.1 cents in 2010 and comparable with levels in 2007-08.
Under 7 Cents of the Food Dollar Is Value Added by U.S. Farms
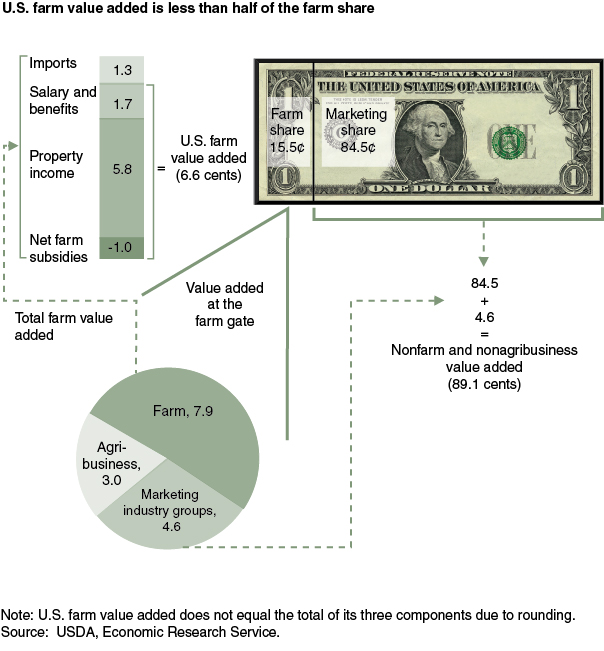
This 15.5 cents represents the value of, or costs of producing, the farm commodities that go into a typical dollar’s worth of food. But how much of this 15.5 cents stays with the farmer and how much goes to other businesses for farm-level inputs? The farm share includes farm value, services and supplies from agribusinesses, and inputs from the other marketing industry groups. (The nine marketing industry groups in ERS’s Food Dollar Series are food processing, packaging, transportation, food retailing, foodservice, energy, finance and insurance, advertising, and legal and accounting.) For example, the energy industry group supplies natural gas to agribusinesses producing nitrogen fertilizers used on U.S. farms, and the finance and insurance industry group supplies financial services to U.S. farmers. Inputs from the nine marketing industry groups accounted for 4.6 cents of the 15.5-cent farm share in 2011, and agribusinesses (establishments selling farm inputs that are not part of the nine marketing industry groups) added 3.0 cents of value.
From the remaining 7.9 cents of farm value added, 6.6 cents was produced on U.S. farms and 1.3 cents represents imported farm commodities purchased as inputs by U.S. producers, such as Canadian wheat purchased by U.S. flour mills to make flour marketed domestically. Most of the value added produced on U.S. farms represents property income (5.8 cents in 2011), or income to capital, accruing to the farmer(s) who own the farm operation. The value added by hired farmworkers, in terms of salaries and benefits, amounted to 1.7 cents. Net farm subsidies from the Government lowered farm commodity costs per food dollar by about 1 cent in 2011.
Imported Farm Commodities Are a Growing Share of U.S. Produced Food
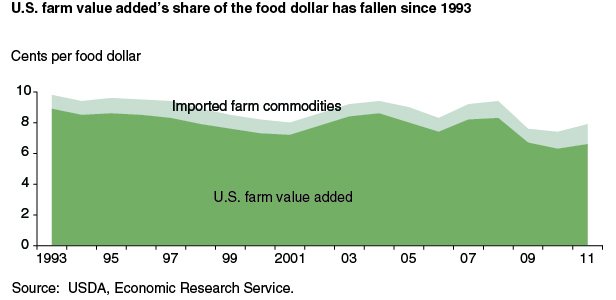
The U.S. farm value-added share of the food dollar has trended downward since the 1990s. In 1993, the share was 8.9 cents, and its low during the period was 6.3 cents in 2010. Imported farm commodities used by domestic food producers reached their highest share of the food dollar over this period in 2011, at 1.3 cents, or around 20 percent of U.S. farm value added in 2011.
This article is drawn from:
- Food Dollar Series. (n.d.). U.S. Department of Agriculture, Economic Research Service.