
New Analysis Reveals Significant Within-State Variation in SNAP Participation Rates
- by Erik Scherpf and Constance Newman
- 12/16/2013
One of the key performance measures of USDA’s Supplemental Nutrition Assistance Program (SNAP) is the proportion of program-eligible individuals who receive benefits. This measure is commonly referred to as the SNAP participation rate and serves as an important metric for identifying subpopulations with unmet food assistance needs. Estimates of SNAP participation rates are regularly published at the State and national level, but estimates of SNAP participation for children, the elderly, or other subpopulations within individual States have not been available. Characterizing SNAP participation in a State with just a single rate likely obscures important variation in SNAP participation across demographic subgroups and geographic areas within the State.
To develop a framework for producing more detailed SNAP participation rates within States, ERS researchers linked SNAP administrative records from Texas to individual and household records in the Census Bureau’s American Community Survey (ACS). The researchers found significant geographic differences in SNAP participation in 2009, both across counties and congressional districts. The congressional districts that comprise the large urban areas of Dallas and Houston exhibited the lowest rates, while districts in the southwest and southern portions of the State exhibited the highest SNAP participation rates.
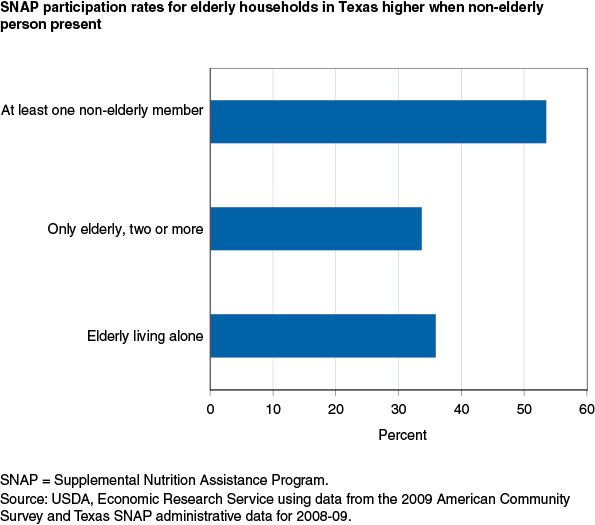
Nationally, the participation rate of elderly Americans—age 60 and older—has been low relative to other age groups. Just over 1 in 3 elderly individuals eligible for SNAP participated in the program in fiscal year 2009, compared to about 9 out of every 10 eligible children, and 7 out of 10 eligible non-elderly adults. Similar results hold for Texas. However, closer examination reveals that the SNAP participation rate was significantly higher in households where an elderly person lived with at least one other non-elderly person than in those households where an elderly person lived alone or only with other elderly individuals. For example, 35.9 percent of eligible elderly Texans living alone participated in SNAP in 2009. By contrast, the participation rate among individuals in elderly households with at least one non-elderly member was 53.5 percent.
Elderly Texans’ participation in SNAP also varied across counties. For instance, in Hidalgo County, participation rates for individuals in the “60 to 69” and “70 and over” age groups were 59.2 and 56.2 percent, respectively. In El Paso County, the rates for these age groups were 51.3 and 48.8 percent, respectively. Both counties were above the State average for these age groups (43.2 and 39.4 percent). ERS researchers also estimated SNAP participation rates for a variety of other subgroups in Texas, including those distinguished by race and Hispanic origin, educational attainment, household composition, and employment status.
This article is drawn from:
- Newman, C. & Scherpf, E. (2013). Supplemental Nutrition Assistance Program (SNAP) Access at the State and County Levels: Evidence From Texas SNAP Administrative Records and the American Community Survey. U.S. Department of Agriculture, Economic Research Service. ERR-156.