
Understanding Farm Income’s Role in Farm Household Finances
- by Jeremy G. Weber and Ron Durst
- 4/1/2013
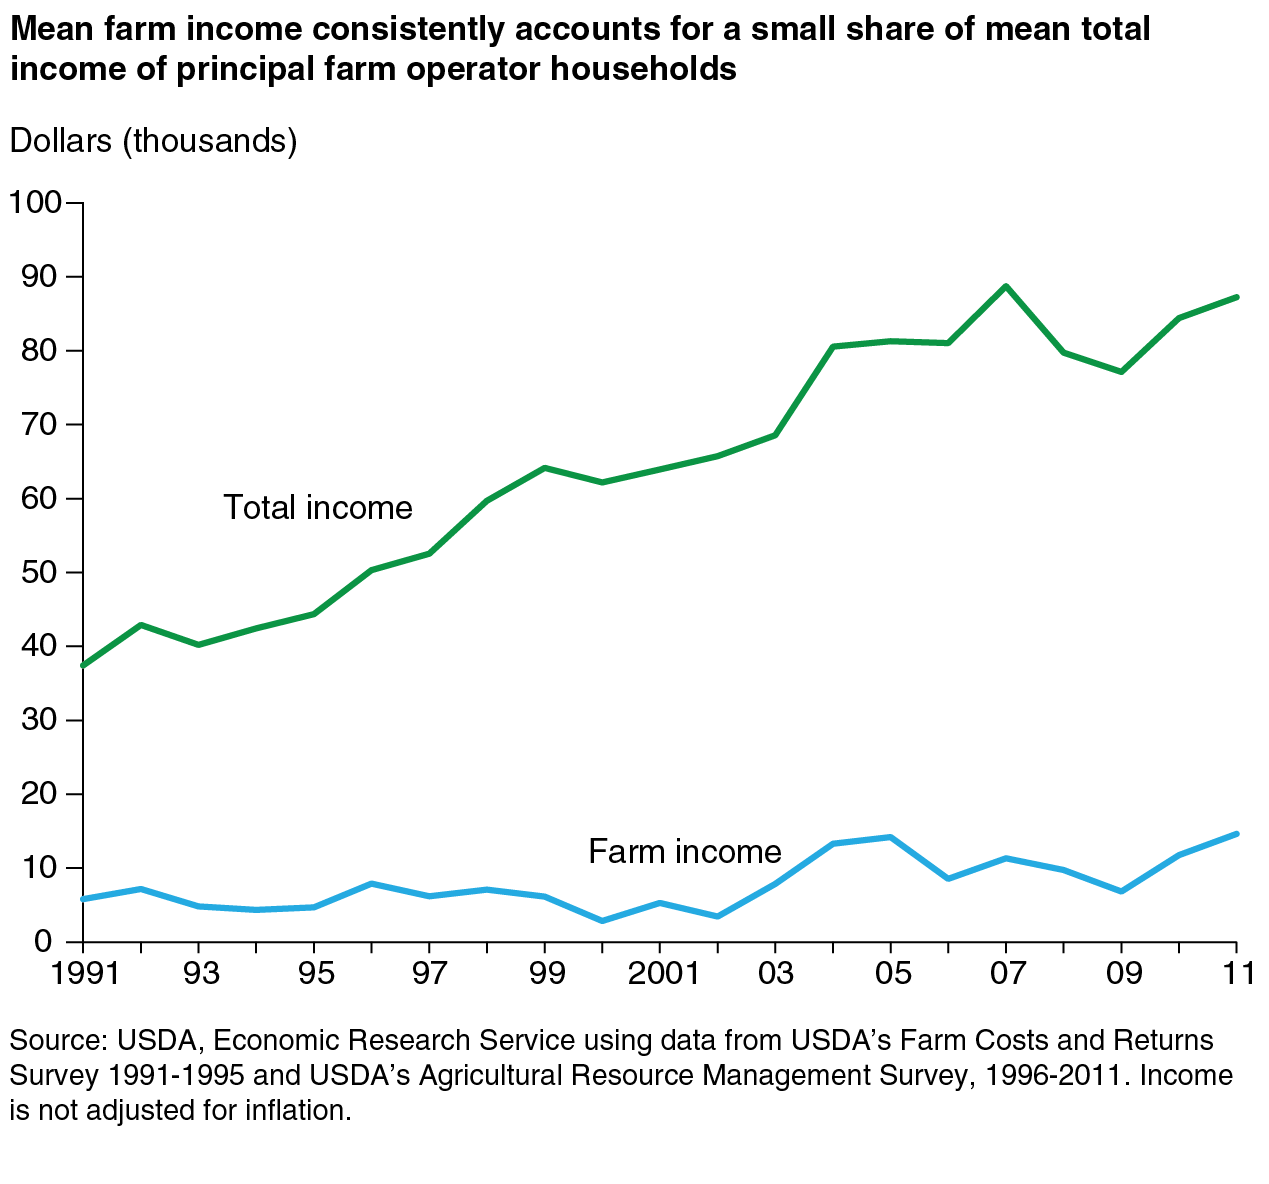
Over the last 20 years, farm income has represented a relatively small share of total farm household income, accounting for as little as 4.6 percent of total income per year and never more than 17.5 percent. This historical pattern supports the counterintuitive notion that farming matters little to the financial well-being of U.S. farm households. However, the share of farm income to total farm household income can be misleading.
The broad definition of a farm results in a farm household population that includes many households with little or no involvement in production agriculture. While many people may not consider a full-time lawyer with several horses or a retired couple with several acres in the Conservation Reserve Program to be farmers, USDA does. To be a farm, a place must only have the potential to generate $1,000 in agricultural sales, including government payments, in a normal year. Many places meeting the definition have little or no agricultural sales in a given year. In 2011, roughly half of all U.S. farms had less than $10,000 in sales and 17 percent had no sales. Furthermore, over time, more households with limited involvement in agricultural production are included in the farm household population because the $1,000 threshold has not been adjusted for inflation.
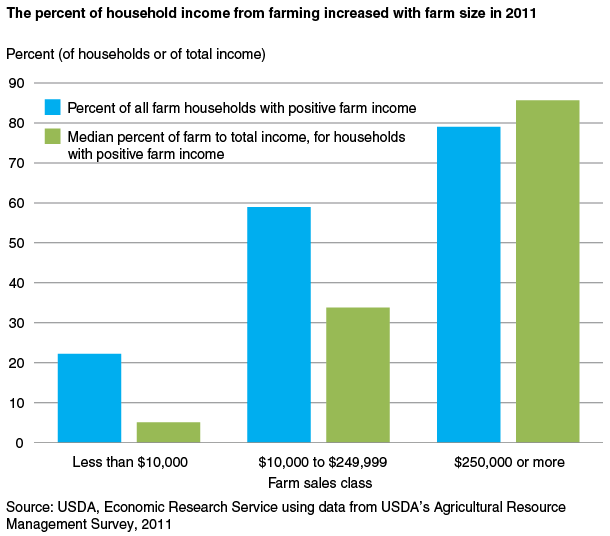
The share of total farm income to total income treats the farm household population as one large household, ignoring the distribution of income. The share would be the same if 10 percent of households earned all of the farm income in the population (and were dependent on it) or if farm income were equally distributed across all households (with none dependent on it). Because of negative farm income for most U.S. farm households, the 10 percent of households with the most farm income accounted for 160 percent of total farm income in 2011. By extension, farm income is of secondary importance to most midsized farms (annual sales of $10,000 to $249,999). Roughly 60 percent of the households operating midsized farms had positive farm income in 2011; for this 60 percent, farming typically accounted for only 34 percent of total household income.
Helpful Alternative Statistics
The role of farm income is better understood by looking at two complementary statistics: the percent of households with positive income from farming and, for them, the median percent of total household income coming from farming. (The median percent is the percent at which half of households are less dependent on farm income and half are more dependent.) When disaggregated by farm sales class, it becomes clear that farm income contributes little to the annual income of farm households operating smaller farms, is a secondary source of income for those operating midsized farms, and is a primary source of income for those operating farms with $250,000 or more in sales per year.
Annual Income Is an Incomplete Measure of Financial Well-Being
Accounting and tax principles used to calculate business income often overstate actual farm expenses and understate other economic benefits. As is true of many other family-owned businesses, farm ownership can affect household finances in ways that are not captured as annual income. For example, farmers can consider part or all of their investment in farm machinery and equipment as a deductible expense in the year it is purchased. Over the last decade, the amount that can be considered an expense in the current year increased from $20,000 to $500,000. As a result, total annual depreciation (including capital expensing) reported by farms has increased by over $11 billion since 2000, to $28.2 billion in 2011. This, in turn, has lowered farm household income from farming. In 2011, the average farm had $28,637 in net cash income, which does not include depreciation. At the same time, farmers claimed an average depreciation expense of $12,239, reducing reported farm business income by more than 40 percent. As evidence of the relative importance of this expense for farms with sales under $10,000 (roughly 50 percent of all farms), depreciation expenses accounted for 57 percent of the total value of their reported farm sales in 2011, compared with only 7.9 percent of sales for farms with sales over $250,000.

The increased depreciation expense reduces net farm income and increases both the number of farms reporting a loss and the size of their loss. However, the losses often contribute to farm household income by reducing the taxes that would otherwise be due on nonfarm income. This economic benefit to the farm household can be significant. In 2010, farm sole proprietors reported a total loss for tax purposes of about $24 billion, which contributed several billion dollars to their after-tax household income.
While a large share of capital investments can be expensed in the year they are made, household farm income excludes other types of economic returns as well, such as the increase in the value of farm assets, especially farmland. Appreciation of land raises the return to land as an investment and increases farm household wealth without necessarily affecting the current year’s farm income. In contrast, expenses associated with land ownership, such as interest payments and real estate taxes, are current expenses that reduce farm income. To a large extent, these non-money-income considerations help explain why some farm households can lose money year after year yet continue to farm.
This article is drawn from:
- ARMS Farm Financial and Crop Production Practices. (n.d.). U.S. Department of Agriculture, Economic Research Service.
- Farm Household Income and Characteristics. (n.d.). U.S. Department of Agriculture, Economic Research Service.
You may also like:
- Federal Tax Issues. (n.d.). U.S. Department of Agriculture, Economic Research Service.
- Farm Household Well-being. (n.d.). U.S. Department of Agriculture, Economic Research Service.