
SNAP Benefits Alleviate the Intensity and Incidence of Poverty
- by Laura Tiehen and Michele Ver Ploeg
- 6/5/2012
Highlights
- The official U.S. poverty measure does not account for noncash government assistance, such as benefits from USDA's Supplemental Nutrition Assistance Program (SNAP).
- Adding SNAP benefits to family income reduces the poverty rate and leads to even greater reductions in depth and severity of poverty, particularly among children.
- The antipoverty effect of SNAP was especially strong in 2009, when the American Recovery and Reinvestment Act increased SNAP benefits levels.
The Federal Government spends billions of dollars each year on programs to alleviate poverty and hardship. Many of these programs provide eligible people with in-kind, or noncash, benefits, such as subsidized rents and assistance with home energy bills. To help eligible households meet their food needs, USDA offers in-kind assistance through a variety of programs, including benefits for the purchase of groceries through the Supplemental Nutrition Assistance Program (SNAP); coupons or electronic benefit cards for specific foods through the Special Supplemental Nutrition Assistance Program for Women, Infants, and Children (WIC); and free or reduced-price meals through the National School Lunch and School Breakfast Programs. Expenditures for these four programs totaled $97 billion in fiscal year 2011, accounting for over 90 percent of USDA food and nutrition assistance expenditures.
Official U.S. poverty estimates do not account for these and other in-kind benefits in family income. This may understate the resources of U.S. families that receive benefits and mask the greater relative hardship facing families that do not receive benefits. Even if in-kind benefits were included as income in poverty estimates, a simple poverty rate--how many people are living below the poverty threshold--may not show how hardship is reduced by government programs with progressive benefit structures, such as SNAP. Under SNAP, eligible families with lower incomes receive larger benefits than similarly sized eligible families with higher incomes. Larger benefits certainly reduce hardship for the poorest families but may not be enough to lift them out of poverty.
A measure that captures the depth or severity of poverty can help policymakers more accurately assess the effects of programs designed to help the poor. ERS researchers and colleagues found that SNAP benefits have a relatively stronger effect on the depth and severity of poverty than on the simple poverty rate when benefits are included in the income tally of poor families. SNAP was particularly successful in lessening poverty among children--a group with significantly higher rates of poverty than the overall population.
New Supplemental Measure Better Reflects Antipoverty Effects
For the last half century, the U.S. Government has provided annual estimates of the number and percentage of people who are poor in the United States as indicators of the well-being of the Nation. As initially developed during the Kennedy Administration, these official measures of poverty use data from the late 1950s and early 1960s to create a standard of need, or threshold, to cover life's necessities. Families with resources at or below the threshold are counted as poor.
The tallying of family resources and the thresholds to which those resources are compared have faced heavy criticism over the years. The thresholds have come under fire because they are based on outdated information on family spending patterns. A major criticism of the measure of a family's resources is that it is based on pre-tax cash income, which excludes not only the value of in-kind benefits from SNAP and other food and nutrition assistance programs but also the impact of the tax code (see box, 'Needs and Programs Have Changed, But Official Poverty Measure Has Not').
In 1995, Congress asked the National Academies to address criticisms of the current poverty measure. An expert panel recommended that the poverty thresholds be based on expenditures for food, clothing, shelter, and a 'small amount for other needs' for things like personal items and household supplies. It also recommended using a disposable income concept to measure family resources. Such a measure would more accurately reflect the income available to a family by adding the value of in-kind benefits and any tax credits to cash income and subtracting taxes owed and other necessary expenses, such as work-related child care and transportation and medical out-of-pocket expenses.
In November 2011, the U.S. Census Bureau released estimates of poverty based on a new Supplemental Poverty Measure (SPM). The SPM, which is meant to augment official poverty estimates, is largely based on recommendations of the National Academies panel but with some modifications based on research and data developed since 1995. Under the SPM, 16 percent of Americans were considered to be poor in 2010, compared with the official poverty rate of 15.2 percent. If SNAP benefits were excluded from income, the SPM poverty rate would have been 17.7 percent, illustrating the importance of accounting for in-kind government assistance. Measures similar to the SPM have also been used in recent State- and city-level studies to show that government assistance reduced the detrimental effect of the recent recession on poverty.
Intensity, as Well as Incidence, of Poverty Matters
Policymakers assessing the effectiveness of antipoverty programs can benefit from accurate information on both the number of people in poverty and the intensity of the poverty experienced. Drawing on one component of the SPM methodology, researchers at ERS, the World Bank, and the University of Illinois included the value of SNAP benefits in family income to get a more accurate view of SNAP's anti-poverty effects.
The researchers used two measures that provide richer information than the poverty rate about the intensity of poverty and the distribution of incomes of the poor. The poverty gap index incorporates information about the distances between family incomes and the poverty threshold, providing a picture of the depth of poverty. The poverty gap index depends on the amount of public assistance needed to raise all poor families up to the poverty threshold. The squared poverty gap index also uses information on how far families' incomes are below the poverty threshold but places more weight on families whose incomes place them far below the poverty line. The squared poverty gap index is more sensitive to income changes among the poorest of the poor and, thus, portrays the severity of poverty.
Both of these measures capture increases in well-being generated by public assistance, even if the assistance is not large enough to move a poor person above the poverty threshold. For example, if public assistance decreases the average distance between the incomes of the poor and the poverty threshold by 25 percent but does not change the poverty rate, the poverty gap index will decrease by 25 percent. The squared poverty gap index, on the other hand, provides information about whether the assistance reaches the poorest families.
For example, suppose two families--one with a household income equal to 50 percent of the poverty threshold and the other with a higher income equal to 75 percent of poverty--received the same amount of SNAP benefits. In both cases, the assistance was not enough to lift either household above the poverty threshold and, therefore, will not reduce the poverty rate. Since the SNAP benefit amounts are equal, each will reduce the poverty gap index by the same amount. However, since the first family is poorer, the assistance it receives will lower the squared poverty gap index more than the equivalent assistance received by the second family. In general, the lower the incomes of the families receiving public assistance, the greater the decrease in the squared poverty gap index.
SNAP's Progressive Benefit Structure Is Well-Suited To Reduce the Intensity of Poverty
Considering the depth and severity of poverty is especially important when evaluating government programs, such as SNAP, that are structured so that a participant's benefits increase when income decreases. To be eligible for SNAP, a household must have low levels of income and assets (for example, gross household income before taxes in the previous month must be at or below 130 percent of the poverty line). The SNAP benefit formula is a function of the maximum SNAP benefit amount, which is based on the estimated cost of a nutritionally adequate diet for a given household size, and the household's net income.
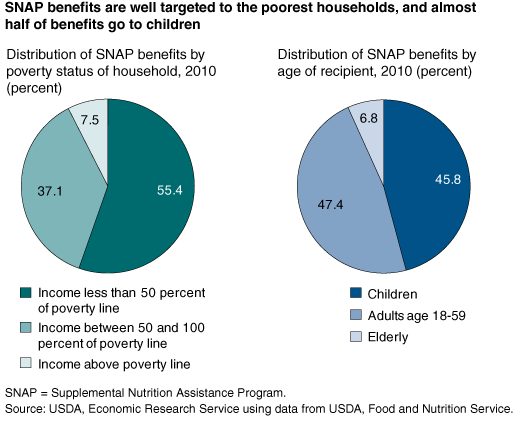
Households with no net income receive the maximum SNAP benefit. For a three-person household in 2012, the maximum benefit is $526 per month. For each additional dollar in household net income, SNAP benefits are reduced by 30 cents, reflecting the expectation that a household can contribute 30 percent of its own income to its food budget. Under this progressive benefit structure, the poorest SNAP households receive the largest benefits. Indeed, administrative data from USDA show that SNAP benefits are targeted to the poorest of poor households. Households with income below 50 percent of the poverty line received over half of SNAP benefits each year from 2000 to 2009.
Researchers from ERS, the World Bank, and the University of Illinois recently estimated three poverty measures--the poverty rate, the poverty gap index, and the squared poverty gap index--for each year from 2000 to 2009, after adding SNAP benefits to the measure of family income used in the official poverty measure. The researchers found that, because of its benefit structure, SNAP had a larger effect on reducing the depth (down an average of 10.3 percent per year) and severity (down 13.2 percent) of poverty than on reducing the prevalence (down 4.4 percent) of poverty.
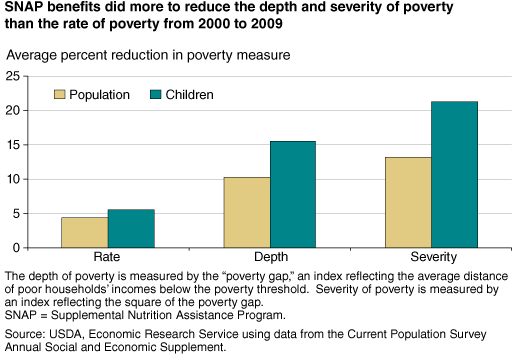
SNAP benefits were shown to have a particularly strong alleviative effect on poverty among children. Children experience significantly higher rates of poverty than the overall population and receive almost half of total SNAP benefits. The official poverty rate for children in 2009 was 20.7 percent, compared with 14.3 percent overall. When SNAP benefits were added to family income, the average decline in the depth of child poverty was shown to be 15.5 percent from 2000 to 2009, and the average decline in the severity of child poverty was 21.3 percent. The substantial reduction in the severity of child poverty from SNAP benefits illustrates that program benefits are targeted to children in the poorest of poor families.
SNAP's Impact Particularly Strong in 2009
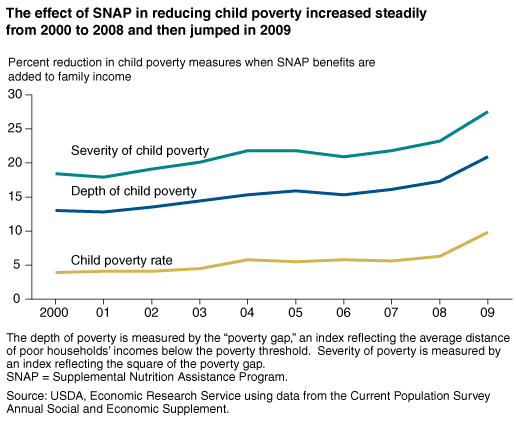
SNAP's effect on reducing poverty increased between 2000 and 2009, when the SNAP caseload nearly doubled to a monthly average of 33.5 million Americans. The caseload increase was likely a result of SNAP policy changes that simplified the application process and expanded eligibility and of greater need due to two economic downturns during this period.
In response to worsening economic conditions, Congress passed the American Recovery and Reinvestment Act (ARRA), also known as the stimulus package, in February 2009. The ARRA contained provisions to raise maximum SNAP benefit levels by 13.6 percent beginning in April 2009. The increase in SNAP benefits and participation resulted in a large increase in SNAP's antipoverty effect between 2008 and 2009. In 2009, the official U.S. poverty rate was 14.3 percent. Accounting for the effects of SNAP benefits, however, would have lowered the poverty rate to 13.2 percent. This 7.7-percent drop translates into lifting roughly 3.4 million people out of poverty that year.
As in earlier years, the antipoverty effect of SNAP was particularly strong for children. In 2009, according to ERS research, SNAP benefits reduced the depth of child poverty by 20.9 percent. The reduction stemmed from SNAP lifting some children out of poverty and, for those children not lifted out of poverty, decreasing the gap between their family income and the poverty threshold. Counting SNAP benefits as income raised the average income of poor families with children from 51 percent of the poverty threshold to 58 percent of the poverty threshold. SNAP benefits also reduced the severity of child poverty by 27.5 percent in 2009.
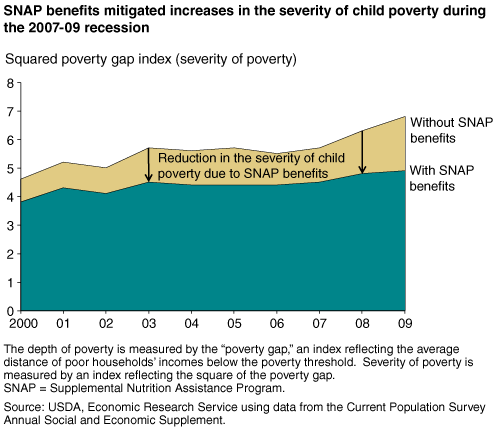
SNAP benefits ensured that the depth and severity of poverty, and particularly child poverty, increased only slightly from 2008 to 2009 despite worsening economic conditions during the 2007-09 recession. Without SNAP, the squared poverty gap index would have increased from 5.5 in 2006 to 6.8 in 2009, an increase of almost 24 percent. With SNAP benefits, the squared poverty gap index rose by only 11 percent (from 4.4 in 2006 to 4.9 in 2009).
Including SNAP benefits in the calculation of a family's resources provides a more accurate view of how SNAP raises the disposable income of recipients and improves the welfare of low-income families. The poverty gap and squared poverty gap indices--measures that convey the depth and severity of poverty--can be useful for assessing need and understanding the consequences of SNAP and other assistance programs. Policymakers can use the indices to measure progress toward improving the well-being of the poor and, in the case of the squared poverty gap index, to measure progress toward reducing severe hardship among the poorest of the poor.
This article is drawn from:
- Tiehen, L., Jolliffe, D. & Gundersen, C. (2012). Alleviating Poverty in the United States: The Critical Role of SNAP Benefits. U.S. Department of Agriculture, Economic Research Service. ERR-132.
- 'Poverty Measurement: Orshansky's Original Measures and the Development of Alternatives'. (2008). Review of Agricultural Economics. Vol. 30, No. 3, pp. 581-90.
- Food Stamp Benefits and Childhood Poverty in the 1990s (FANRR-33). (2003). Economic Research Service. Food Stamp Benefits and Childhood Poverty in the 1990s, by Dean Joliffe, Craig Gundersen, Laura Tiehen, and Joshua Winicki, FANRR-33, USDA, Economic Research Service, September 2003..
You may also like:
- Andrews, M. & Smallwood, D. (2012, March 1). What’s Behind the Rise in SNAP Participation?. Amber Waves, U.S. Department of Agriculture, Economic Research Service.