
The Concentration of Poverty Is a Growing Rural Problem
- by Tracey Farrigan and Timothy Parker
- 12/5/2012
Highlights
- Concentrated poverty has increased in the U.S. over the last decade, particularly in nonmetropolitan areas and in areas with distinct racial/ethnic minority populations.
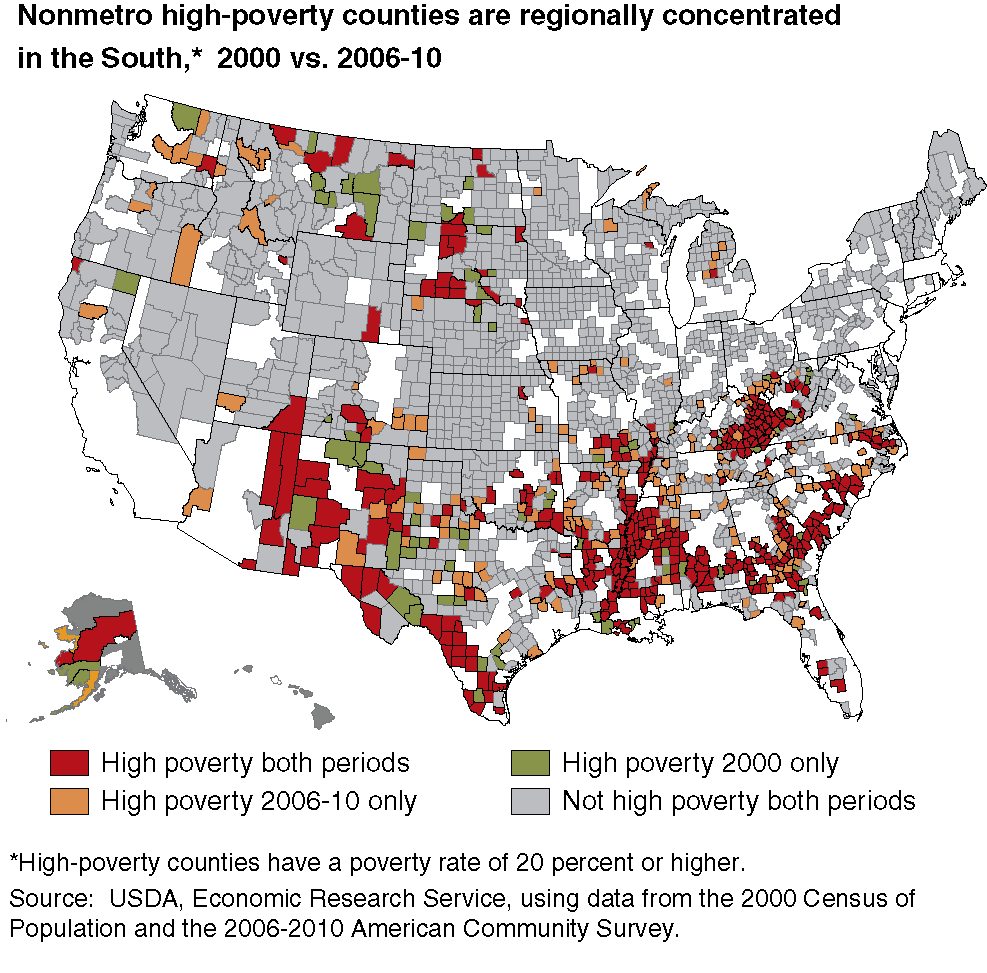
- Historical regional concentrations of high poverty persist in the South, but there is evidence of emergent concentrations in the West and Midwest.
- The spread of nonmetropolitan concentrated poverty is associated with the recent economic recession and the slow pace of the recovery.
While the 2001 and 2007-09 economic recessions increased the incidence of poverty throughout the Nation, perhaps more troubling was the increasing concentration of poverty over the last decade. In the United States, people living in poverty tend to be clustered in certain regions, counties, and neighborhoods rather than being spread evenly across the Nation. Research has shown that the poor living in areas where poverty is prevalent face impediments beyond those of their individual circumstances. Concentrated poverty contributes to poor housing and health conditions, higher crime and school dropout rates, as well as employment dislocations. As a result, economic conditions in very poor areas can create limited opportunities for poor residents that become self-perpetuating.
While the incidence of poverty in rural America has been widely recognized since official measures of poverty were first published in the early 1960s, the public has generally perceived concentrated poverty as being an urban, central-city problem. This urban focus grew largely out of the impacts of de-industrialization, abrupt suburbanization, and civil unrest on inner city neighborhoods in the 1960s and 1970s. Previous research often emphasized concentrated poverty as a proxy for a broader set of socioeconomic disadvantages affecting a predominantly low-income minority population in urban areas. Despite sharing similar patterns of geographic and economic isolation, minorities and other high-poverty populations in more sparsely settled rural settings are less visible than their urban counterparts. But the incidence of concentrated poverty in nonmetro areas (a working definition of “rural America”), and the burden imposed on the poor residing in those areas, is a growing problem.
ERS uses a county-based measure and data from the 2000 decennial census and the 2006-2010 American Community Survey (ACS) to highlight patterns of poverty concentration. Researchers identify new and pre-existing “high-poverty” counties—where at least 20 percent of the population have incomes below the Federal poverty threshold—and associated demographic and geographic characteristics, including the percentage of the poor that live in high-poverty counties and the extent to which the counties are spatially clustered. This is the most widely adopted approach for examining concentrated poverty in rural America (see box, 'Geographic Definitions and Data').
High Poverty Increased Nationwide, but More so for Nonmetro Areas
The poverty rate for the U.S. nonmetro population was 16.5 percent in 2006-10, up from 14.8 percent in 2000. Likewise, the average poverty rate for nonmetro counties was higher in 2006-10 (16.7 percent) than in 2000 (15.6 percent). When poverty rates are trending upward, it is expected that the number of counties with poverty rates of 20 percent or greater will increase and, therefore, that a higher percentage of the poor will be living in them. A comparison of nonmetro counties and metro counties finds that both areas experienced significant growth in the number of high-poverty counties between 2000 and 2006-10, but the increase was greater for nonmetro counties.
Historically, the prevalence of high-poverty counties and the share of the poverty population residing in high-poverty counties have been higher in nonmetro areas than in metro areas. These trends continued between 2000 and 2006-10. In 2006-10, 26.2 percent of the Nation’s nonmetro counties were high poverty, 5.8 percentage points higher than in 2000. About 36.1 percent of the nonmetro poverty population resided in high-poverty counties in 2006-10, up 6.2 percentage points from 2000. Among metro counties, 10.3 percent were high poverty in 2006-10, 3.7 percentage points higher than in 2000. The share of the metro poverty population residing in those counties was 14.5 percent, up 1.5 percentage points from 2000.
A Disproportionate Share of Nonmetro Minorities Are Exposed to High Poverty
An extensive body of research finds that the well-being of families and children living in high-poverty areas is undermined by a lack of access to mainstream social and economic opportunities. For example, children who grow up in high-poverty neighborhoods are less likely to succeed academically, complete high school, or attend college than those who grow up elsewhere. Research also finds that pervasive isolation characterized by social, racial, linguistic, and economic separateness from the larger economy underlies poverty concentration. While this research has primarily focused on the plight of minorities in urban neighborhoods, the relatively large share of minorities in rural areas who are exposed to high poverty implies that these problems are not uniquely urban.
For example, in 2006-10, the average nonmetro African American or Native American resided in a county where the poverty rate was 22 percent, and the average nonmetro Hispanic resided in a county where 18 percent of the population was poor. In comparison, the average metro African American, Native American, or Hispanic person resided in a county where 14-15 percent of the population was poor. This suggests that nonmetro racial/ethnic minorities are often significantly more entrenched in areas of high poverty than are their metro counterparts and are thereby likely to suffer many of the problems and limitations associated with urban poverty, even if they are not poor themselves.
While anyone living in a high-poverty area may confront the socioeconomic challenges that accompany day-to-day life to some extent, those challenges weigh most heavily on those who are themselves poor and who may have fewer options to live elsewhere. Nonmetro African American and Native American poor are at high risk of being in this situation given that more than 60 percent of these populations reside in a high-poverty county. The nonmetro poor who are foreign born, have less than a high school degree, or are female heads of families with children are also at high risk. The metro counterparts for all of these populations are less likely to be at risk given that significantly smaller shares reside in high-poverty counties.
| Demographic characteristics | Percent poor living in high-poverty counties, nonmetro | Percent poor living in high-poverty counties, metro |
|---|---|---|
| White, one race | 27.9 | 11.9 |
| Black / African American, one race | 67.6 | 20.0 |
| American Indian / Alaskan Native, one race | 60.5 | 13.9 |
| Hispanic, any race | 39.6 | 18.4 |
| Age less than 18 | 37.4 | 15.4 |
| Age 18 to 64 | 36.1 | 14.2 |
| Age 65 or older | 32.4 | 13.2 |
| Foreign born | 40.9 | 15.2 |
| Less than high school degree, age 25 or older | 41.1 | 16.9 |
| Female-headed families with related children under age 18 | 40.4 | 16.0 |
| Working poor (employed civilian labor force age 16 or older) | 32.1 | 12.9 |
| Source: USDA, Economic Research Service using data from the American Community Survey 5-year estimates for 2006-10. | ||
Historic Regional Concentrations Persist
High-poverty areas tend to be clustered into groups of contiguous counties that reflect distinct regional concentrations. This can pose special problems by taxing the resources that State and local governments can bring to bear to address poverty. The majority of nonmetro high-poverty counties and nonmetro poor are located in specific geographic areas with a long history of distressed or transitioning regional economies, many with a former dependency on natural resources and/or a largely low-skill minority population. High levels of nonmetro poverty are pervasive in the South, particularly in the Cotton Belt, Southern Appalachia, the Rio Grande, and the Mississippi Delta. Poverty rates are typically highest at the cores of these high-poverty clusters and then taper off gradually toward the edges.
There were 193 nonmetro counties newly defined as high poverty in 2006-10, compared with 55 metro counties. Most of the new nonmetro high-poverty counties are adjacent to previously existing high-poverty clusters. The majority are in the Southern Interior Uplands, the Cotton Belt, the Southern Piedmont, and the Southern Great Plains. These regions are characterized by historically high rates of poverty for rural racial/ethnic minority populations (see “Anatomy of Nonmetro High Poverty Areas” in the February 2004 issue of Amber Waves). Findings also reveal an emerging nonmetro high-poverty region in the Pacific Northwest and a more dispersed pattern of new high-poverty counties elsewhere in the West and the Midwest. This suggests that not only has the incidence of concentrated nonmetro poverty increased over the last decade but that it has also become more widespread.
The geographic spread of concentrated poverty is reflected in greater racial/ethnic diversity of the high-poverty population. Although concentrated poverty increased among rural minority populations over the study period, it also increased among rural Whites. The share of the nonmetro African American poverty population in high-poverty counties rose by 13.6 percentage points between 2000 and 2006-10. Changes in the nonmetro White and Hispanic poverty populations over the same period were similar, with increases of 9.4 percentage points and 9.8 percentage points, respectively. Prior periods of growth in concentrated poverty (1970s-1990s) affected the White population to a much lesser extent than minority populations.
Growth in Concentrated Nonmetro Poverty Mirrors Broader Economic Trends
Not surprisingly, the geography of newly designated high-poverty nonmetro counties tracks closely with changes in the national economy. More than one-third of these counties were manufacturing-dependent counties in 2000, many of which experienced above-average increases in unemployment between 2000 and 2006-10 (see "On the Map" in the June 2012 issue of Amber Waves). This suggests that while the 2007-09 economic recession did not have the same effect on rural America as other recent recessions (see "Economic Recovery: Lessons Learned From Previous Recessions" in the March 2010 issue of Amber Waves), it had a pronounced effect on nonmetro poverty concentration, while also reinforcing historic regional and demographic trends.
This article is drawn from:
- Rural Poverty & Well-Being. (n.d.). U.S. Department of Agriculture, Economic Research Service.