
Where Did the Corn Come From To Fuel the Expansion in Ethanol Production?
- by Steven Wallander, Roger Claassen and Cynthia Nickerson
- 9/1/2011
Between 2000 and 2009, U.S. ethanol production increased from 1.6 billion gallons to 10.8 billion gallons, almost all of which was produced from corn. While some of the corn came from increased yields and some was diverted from other uses, much of the corn needed to produce ethanol came from expanding planted acreage. Between 2000 and 2009, U.S. corn production increased from 9.9 billion bushels grown on 72.4 million acres to 13.1 billion bushels grown on 79.5 million acres.
This period of rapid change is reflected in both aggregate (national, State, and county) and farm-level data on crop acreage. To see this, ERS researchers looked at large-scale changes in land use at the national level and more disaggregated changes at the State and county levels before examining individual farm-level changes. The farm-level changes, captured in a special version of USDA's Agricultural Resource Management Survey (ARMS), provide important insight not evident in the more aggregated data about how producers expanded corn acreage.
National-level data show that between 2006 and 2007, a large increase in corn acreage was accompanied by a sizable decrease in soybean acreage, but this shift largely reversed between 2007 and 2008. Over the long run, there is not an obvious historical shift out of soybeans into corn. Both corn and soybean acreage increased over the past decade.

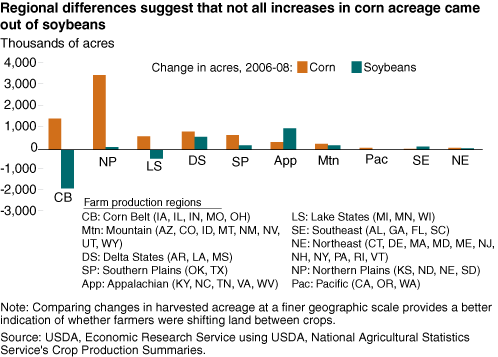
Regional Differences May Explain Why Total Soybean Acreage Did Not Decrease Between 2006 and 2008
Looking at State-level changes in harvested corn and soybean acreage, several States--most notably Illinois, Iowa, and Minnesota--showed large increases in corn acreage with proportional decreases in soybean acreage. Nebraska and North Dakota had large increases in corn acreage accompanied by much smaller reductions in soybean acreage. Other States-South Dakota, Kansas, Mississippi, and Arkansas-had increased corn and soybean acreage. Regional differences suggest that not all increases in corn acreage came out of soybeans.
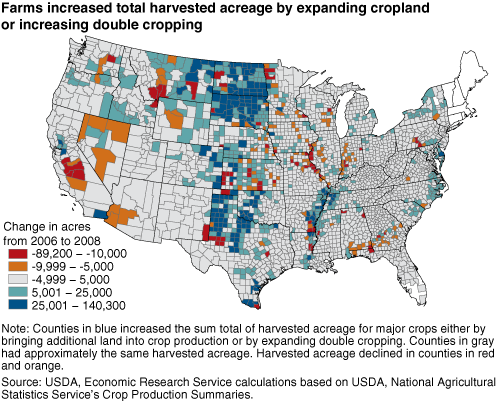
In addition to shifting acreage between crops, farms can also increase total harvested acreage by expanding cropland or by increasing double cropping-the practice of harvesting two crops from the same field in the same year. County-level data show where growth in total harvested acres occurred during the rapid runup in ethanol production.
Outside of the Corn Belt, many counties increased total harvested acres between 2006 and 2008. The question that is difficult to answer without farm-level data: How did farms in these counties increase total harvested acreage?
Shifts From Soybeans to Corn Were Offset by Shifts to Soybeans
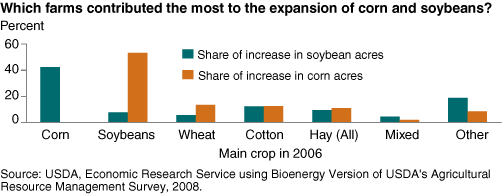
Using a unique farm-level dataset (the 2008 Bioenergy Version of ARMS), ERS researchers compared the planting decisions of farms growing corn or soybeans in 2008 with those in 2006 to measure responses to changing market demand. To understand how different types of farms responded to increased demand for corn, ERS researchers divided farms into groups based on their dominant crop in 2006. Farms that had more than 50 percent of their planted acreage in corn in 2006 were classified as corn farms.
Other farms were classified based on the dominant noncorn crop grown in 2006 (with dominance assigned if a single crop accounted for more than 33 percent of noncorn acreage on the farm). Based on this classification, farms that primarily grew soybeans in 2006 were the main source of new corn acres. However, there was not a net decrease in soybean acres. Reductions in acreage of other crops, as well as an expansion in harvested acres, have been important sources for the simultaneous expansion of corn and soybean production.
This article is drawn from:
- Wallander, S., Claassen, R. & Nickerson, C. (2011). The Ethanol Decade: An Expansion of U.S. Corn Production, 2000-09. U.S. Department of Agriculture, Economic Research Service. EIB-79.
You may also like:
- Corn and Other Feed Grains. (n.d.). U.S. Department of Agriculture, Economic Research Service.
- Bioenergy. (n.d.). U.S. Department of Agriculture, Economic Research Service.
- Soybeans and Oil Crops. (n.d.). U.S. Department of Agriculture, Economic Research Service.