On The Map: Agricultural Productivity Grew in Every State
- by Eldon Ball
- 9/1/2008
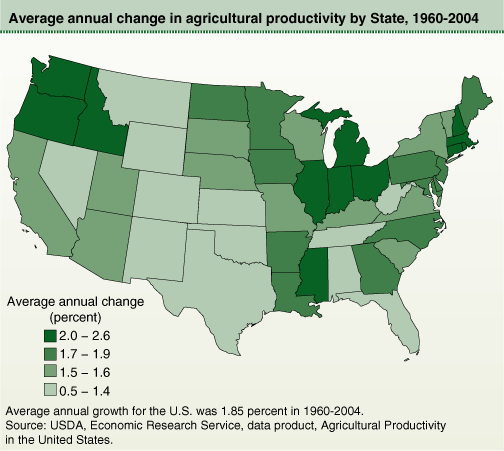
ERS provides estimates of annual growth in agricultural productivity for each of the 48 contiguous States. ERS calculates productivity as the difference between growth in agricultural output and growth in inputs used. Eastern Corn Belt States show the effects of continuing productivity gains in growing feed grains, while innovations in raising hogs and poultry drove high productivity growth in several Southern States. Northwestern States’ relatively high productivity growth reflects shifts to high-value specialty crops and dairy production. Several New England States illustrate a striking development: output and inputs declined, but productivity increased, as higher value commodities and relatively productive land and labor remained in agriculture.