
Education's Role in the Metro-Nonmetro Earnings Divide
- by Lorin Kusmin, Robert Gibbs and Timothy Parker
- 2/1/2008
Highlights
- Average earnings are lower in nonmetro areas than in metro areas, even after accounting for differences in the individual characteristics of nonmetro earners.
- The nonmetro-metro earnings gap is greater for workers with more education and more experience.
- For nonmetro households, lower earnings may be offset by factors difficult to measure, such as lower living costs or the value of rural amenities.
The pay gap between metro and nonmetro workers is one of the most persistent features of the nonmetro economy. In 2006, nonmetro wage and salary workers, at $602 per week, earned 23 percent less, on average, than metro workers, at $783 per week. Lower nonmetro earnings contribute to lower household incomes and higher poverty rates in nonmetro areas.
A variety of factors explains the differences between nonmetro and metro earnings. First of all, metro-nonmetro differences can exist because of differences in the characteristics of workers or because of differences in how those characteristics are rewarded in nonmetro vs. metro areas. Second, differences in the cost of living between nonmetro and metro areas can also influence the earnings gap. Nonmetro workers may be willing to accept lower earnings than they might otherwise receive in metro areas because they have lower expenses for housing, food, and other essentials. However, there is no easy way to quantify cost-of-living differences and so there is a wide dispersion in estimates of the differences. In any case, it appears unlikely that cost-of-living differences can fully explain the large nonmetro-metro earnings gaps faced by the most educated and skilled workers. Third, differences in cultural, natural, and other amenities may also influence wage differences, as workers may accept lower wages in order to live and work in more desirable locations. But, again, the relative value of urban and rural amenities is not easily quantified.
Using data from the Census Bureau’s Current Population Survey, ERS researchers examined the first set of factors explaining the earnings gap—differences in the characteristics of metro and nonmetro workers and the ways those characteristics are rewarded in the labor market. The analysis focuses on differences in total weekly earnings, rather than just wage rates, because differences in earnings may also result from differences in the number of hours worked.
Underlying the earnings gap is a nonmetro economy with a disproportionate share of employment in less-skilled jobs, using a Department of Labor description of job skill requirements. Historically, the farm-based jobs that supported nonmetro areas gave way to low-skill jobs in manufacturing and services, which drew upon the relatively abundant supply of nonmetro workers with limited education. Over time, nonmetro skill levels have risen closer to the national average, but remain below that average.
Nonmetro jobs tend to pay less than jobs in the same occupation in metro areas, especially in those occupations requiring high skill levels. Lower educational attainment and lower rewards to higher education in nonmetro areas are among the key factors explaining the earnings gap. A college graduate in a nonmetro area typically earns less than in a metro area, after adjusting for other personal and job characteristics. Thus, nonmetro areas are doubly disadvantaged by the earnings gap facing their most educated workers: those workers have a strong incentive to move to metro areas, and those who remain are paid less.

Education Is a Major Source of the Nonmetro Pay Gap
The most obvious worker characteristics that contribute to higher wages are those that enhance a worker’s value to an employer because they indicate greater human capital and, hence, enable a worker to be more productive. Years of schooling or work experience are common indicators of human capital.
Despite large gains in recent decades, the educational attainment of nonmetro workers is lower than that of metro residents. The remaining difference in high school completion is small: about 11 percent of nonmetro workers lacked a high school diploma in 2006, compared with 10 percent of metro workers. The disparity widens for college education, with 20 percent of workers in nonmetro areas having a degree versus 33 percent in metro areas.
Further, the nationwide pay gap between those who have completed a 4-year college degree or more and those who have not attended college has widened in recent years. Nationally, in 2006, college graduates earned about 52 percent more and graduates with advanced degrees, 93 percent more than similar high school graduates without college experience. High school graduates in turn earned about 19 percent more than those without a high school degree. This nationwide trend in the job market has increased the importance of the education differences in explaining the metro-nonmetro pay gap.
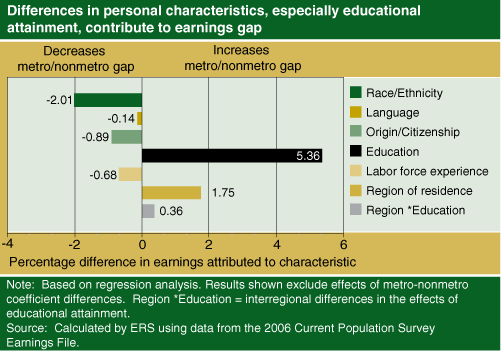
Assuming returns to educational attainment remain constant, if educational attainment in nonmetro areas were the same as in metro areas, nonmetro earnings would be more than 5 percentage points ($31 per week) higher, closing about one-fourth of the metro-nonmetro earnings gap.
Other Characteristics Have Mixed Effects on the Earnings Gap
Some worker characteristics, particularly racial and ethnic makeup, reduce the metro-nonmetro earnings gap. Even after taking other differences into account, Blacks and Hispanics in the U.S. earn about 13 percent less on average than non-Hispanic Whites, and these minority groups make up a smaller share of the nonmetro workforce than the metro workforce. Likewise, workers who have difficulty speaking English or who are noncitizens—both groups whose incomes are lower than those of otherwise comparable earners—are disproportionately metropolitan.
A small portion of the earnings gap is due to the concentration of nonmetro residents in lower earning regions. Nonmetro residents are more likely to reside in the low-wage South and Midwest than metro residents.
The nonmetro economy has a large share of jobs that require limited skills or training—and relatively fewer jobs in the financial and professional business service industries and in managerial and professional occupations. While worker characteristics explain much of the lower nonmetro earnings, the demand of nonmetro employers is largely consistent with these lower skill sets. Overall, industries and occupations that require more skill pay more, although other factors, such as difficult working conditions or a low degree of competition in the industry, can also affect pay.
Similar Characteristics, But Lower Earnings
Differences in worker characteristics such as educational attainment and race/ethnicity account for only about one-sixth of the nonmetro earnings disadvantage. The remainder of the gap occurs because the earnings of workers with similar characteristics also vary between metro and nonmetro areas. For most workers, this gap implies lower expected pay in a nonmetro area, but the size of the differential for nonmetro residence varies considerably by worker characteristics.
Part of the metro-nonmetro wage gap may be explained by a lower cost of living in nonmetro areas, which allows nonmetro employers to attract and retain workers while offering lower wages than are offered in metro areas. However, cost- of-living differences are unlikely to explain the entire wage gap (see box, “Cost-of-Living Differences”), and cannot explain why the gap faced by more skilled and educated workers is disproportionately large.
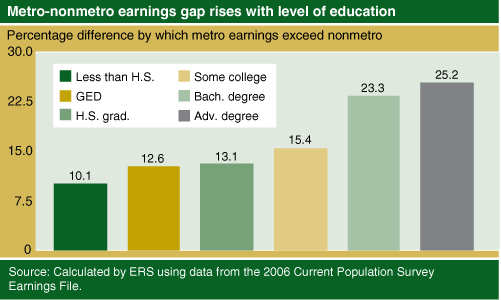
For example, a high school graduate with the same personal characteristics as an average U.S. earner will be paid 13 percent less in nonmetro areas, but the gap widens to 23 percent for a comparable college graduate. The nonmetro penalty for a typical advanced-degree holder is 25 percent. Thus, while college graduates in metro areas earn 56 percent more than their metro counterparts with no more than a high school degree, the premium for a college degree in nonmetro areas is only 37 percent.
If nonmetro workers had the same levels of education as metro workers, and also had similar returns on higher education, nonmetro earnings would have been 11 percent higher than they were in 2006.
The dual educational disadvantage of nonmetro areas is unlikely to be coincidence. The lower demand for highly educated workers among nonmetro employers is reflected in the lower wage premium that nonmetro college graduates command. The lower premium, in turn, may both dampen motivation for rural high school graduates to attend college and increase the net migration of college graduates out of nonmetro areas.
Though critical, education levels are not the sole factor associated with variations in the size of the gap between nonmetro and metro earnings. In general, the earnings gap is larger for women, whether married or single, than men. Workers who are part-time by choice also face a larger earnings disadvantage in nonmetro areas. The nonmetro earnings gap is also greater for more experienced workers, who benefit less from experience than metro workers. On the other hand, the earnings gap faced by noncitizens compared with native-born U.S. citizens with similar personal characteristics is only about half as great in nonmetro areas as in metro areas; the data indicate that some noncitizens with relatively low levels of education and experience may earn more in nonmetro areas than they would in metro areas.
Productivity Differences Lead to Lower Skill Demand in Nonmetro Areas
The relatively low earnings of nonmetro college graduates partly reflect lower productivity that leads to lower demand for their skills and knowledge among nonmetro employers compared with metro employers. Urban centers more often provide complementary productive factors, such as efficient transportation and communications systems, and access to capital and consumer markets, that draw and retain high-skill firms. Moreover, well-educated workers tend to be more productive as individuals when employed in labor markets with large numbers of similar workers. These productivity advantages drive up earnings for metro college graduates, indicated by their larger returns to higher education.
The disparity in metro and nonmetro labor demand is apparent in the greater share of low-skill jobs in nonmetro areas, and in the greater earnings gap for high-skill jobs. The relatively lower concentration of nonmetro workers in the financial, professional service, and business service industries, and in managerial and professional occupations, is associated with lower earnings in nonmetro areas than in metro areas. Further, the earnings premium for working in professional and managerial occupations is 6 to 8 percentage points lower in nonmetro areas than it is in metro areas, even after metro-nonmetro differences in educational attainment premiums are taken into account. Similarly, the metro-nonmetro earnings gap is high in the information industries, which are concentrated in metro areas to take advantage of their productivity-enhancing features.
In contrast, workers in production and transportation occupations face a smaller nonmetro earnings gap than workers in other occupations. A smaller-than-average metro-nonmetro earnings gap is also found for workers in mining, education, health, transportation, and the utilities industries.
Are Regional Earnings Differences Important?
The South historically has been the region with the lowest average earnings because of the concentration of low-skill, labor-intensive jobs in agriculture and routine manufacturing, and the relative lack of integration with the national economy. In today’s economy, however, nonmetro Southern earnings have risen relative to those in other regions and are similar to those in the Midwest. Lower educational attainment and a greater concentration of minorities in the South are largely offset by greater returns to higher education in the South and a greater concentration of voluntary part-time workers in the Midwest.
While the data indicate that, on average, a worker with a low or moderate level of educational attainment and a given demographic profile will earn about the same in the South as in the Midwest, these regions are still at a disadvantage relative to the Northeast and West. However, there is a greater premium for college completion in the South, so workers with a college or advanced degree earn significantly more than comparable workers in the Midwest.
Shrinking the Earnings Gap: What Are the Options?
Education’s dual role in explaining the earnings gap suggests that policies to narrow the gap might seek to raise educational attainment in nonmetro areas, to raise nonmetro returns to education, or both. Improving local schools may help nonmetro areas to retain and attract education-oriented young people with families; this is likely to raise nonmetro educational attainment levels. Places with good schools may also be more appealing to migrants who bring creative and entrepreneurial skills—and presumably higher earnings—into the community. In addition, better schools may benefit rural youth by improving their preparation for either the labor market or further schooling, in either case raising their expected earnings. Firms that employ high-skill, highly paid employees may also be more likely to locate in areas with a better-educated workforce. However, efforts to raise local education levels, including encouraging young people to attend college, may be blunted by the outmigration of many of those who do earn a college degree.
Lower nonmetro earnings mean that a larger share of the rural workforce comprises the working poor and near-poor, who may qualify for public assistance. Therefore, either as an alternative or an adjunct to policies targeted to higher skill jobs and workers, addressing the most acute needs of low-skill, low-wage nonmetro workers could be an appropriate approach to closing the earnings gap. A number of Federal and State efforts—including minimum wage standards, tax remittances such as the Earned Income Tax Credit, and adult training and certification programs—affect the earnings of these workers.
This article is drawn from:
- Employment & Education. (n.d.). U.S. Department of Agriculture, Economic Research Service.
You may also like:
- Gibbs, R., Kusmin, L. & Cromartie, J. (2005). Low-Skill Employment and the Changing Economy of Rural America. U.S. Department of Agriculture, Economic Research Service. ERR-10.
- Kusmin, L. (2002). Wage Premiums for On-the-Job Computer Use: A Metro and Nonmetro Analysis. U.S. Department of Agriculture, Economic Research Service. RDRR-95.
- Education as a Rural Development Strategy. (2005). Economic Research Service. in Amber Waves, Vol. 3, Issue 5. .