Indicators
- Contact: Website Administrator
- 4/1/2008
| Annual percent change | |||||||||
|---|---|---|---|---|---|---|---|---|---|
| 2004 | 2005 | 2006 | 2007 | 2008 | 2004-05 | 2005-06 | 2006-07 | 2007-08 | |
| Cash receipts ($ billion) |
237.3 | 240.7 | 239.3 | 285.4p | 313.2f | 1.4 | -0.6 | 19.3 | 9.7 |
| Crops | 113.7 | 115.9 | 120.0 | 143.9p | 174.6f | 1.9 | 3.5 | 19.9 | 21.3 |
| Livestock | 123.6 | 124.9 | 119.3 | 141.4p | 138.7f | 1.1 | -4.5 | 18.5 | -1.9 |
| Direct government payments ($ billion) |
13.0 | 24.4 | 15.8 | 12.0p | 13.4f | 87.7 | -35.2 | -24.1 | 11.7 |
| Gross cash income ($ billion) |
267.4 | 281.3 | 272.5 | 316.2p | 346.0f | 5.2 | -3.1 | 16.0 | 9.4 |
| Net cash income ($ billion) |
82.2 | 85.8 | 67.9 | 87.6p | 96.6f | 4.4 | -20.9 | 29.0 | 10.3 |
| Net value added ($ billion) |
127.8 | 121.4 | 104.4 | 137.6p | 144.1f | -5.0 | -14.0 | 31.8 | 4.7 |
| Farm equity ($ billion) |
1,401.9 | 1,576.1 | 1,771.8 | 2,002.7p | 2,286.2f | 12.4 | 12.4 | 13.0 | 14.2 |
| Farm debt-asset ratio | 11.5 | 10.9 | 10.5 | 9.9p | 9.1f | -5.2 | -3.7 | -5.7 | -8.1 |
| Farm household income ($/farm household) |
81,596 | 81,599 | 77,654 | 84,159p | 89,434f | 0.0 | -4.8 | 8.4 | 6.3 |
| Farm household income relative to average U.S. household income (%) |
134.8 | 128.8 | 116.7 | na | na | -4.5 | -9.4 | na | na |
| Nonmetro-metro difference in poverty rates (%points)1 |
na | 2.3 | 3.4 | na | na | na | na | na | na |
| Cropland harvested (million acres) |
312 | 314 | 304p | na | na | 0.6 | -3.2 | na | na |
| USDA Conservation Program expenditures ($ billion)2 |
5.1 | na | na | na | na | na | na | na | na |
| f = Forecast. p = Preliminary. na = Not available. All dollar amounts are in current dollars. 1 The methodology for computing these measures has changed. These statistics are not comparable to previously published statistics. 2 Based on October-September fiscal years ending with year indicated. |
|||||||||
| Annual percent change | |||||||||
|---|---|---|---|---|---|---|---|---|---|
| 2004 | 2005 | 2006 | 2007 | 2008 | 2004-05 | 2005-06 | 2006-07 | 2007-08 | |
| U.S. gross domestic product ($ billion) |
11,713 | 12,456 | 13,247 | na | na | 6.3 | 6.4 | na | na |
| Share of agriculture and related industries in GDP (%)1 |
4.8 | 4.5 | 4.3 | na | na | -6.3 | -4.4 | na | na |
| Share of agriculture in GDP (%)1 |
1.0 | 0.8 | 0.7 | na | na | -16.3 | -12.5 | na | na |
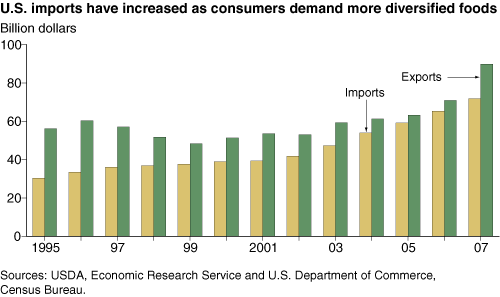
| Total agricultural imports ($ billion)2 |
52.7 | 57.7 | 64.0 | 70.0 | 76.5 | 9.5 | 10.9 | 9.4 | 9.3 |
| Total agricultural exports ($ billion)2 |
62.4 | 62.5 | 68.7 | 81.9 | 101.0 | 0.2 | 9.9 | 19.2 | 23.3 |
| Export share of the volume of U.S. agricultural production (%)1 |
21.3 | 21.7 | 22.3 | 23.0f | na | 1.9 | 2.8 | 3.1 | na |
| CPI for food (1982-84=100) |
186.2 | 190.7 | 195.3 | 202.9 | 212.3f | 2.4 | 2.4 | 3.9 | 4.6 |
| Share of U.S. disposable income spent on food (%) |
9.7 | 9.8 | 9.9 | na | na | 1.0 | 1.0 | na | na |
| Share of total food expenditures for at-home consumption (%) |
51.5 | 51.4 | 51.1 | na | na | -0.2 | -0.6 | na | na |
| Farm-to-retail price spread (1982-84=100) |
232.1 | 239.2 | 246.2 | 248.3 | na | 3.1 | 2.9 | 0.9 | na |
| Total USDA food and nutrition assistance spending ($ billion)2 |
46.2 | 50.9 | 53.1 | 54.3 | na | 10.2 | 4.3 | 2.3 | na |
| f = Forecast. p = Preliminary. na = Not available. All dollar amounts are in current dollars. 1 The methodology for computing these measures has changed. These statistics are not comparable to previously published statistics. 2 Based on October-September fiscal years ending with year indicated. |
|||||||||


