Data Feature: ERS Food Availability Data Look at Consumption in Three Ways
- by Hodan Farah Wells and Jean C. Buzby
- 6/1/2007
ERS Food Availability Data Look at Consumption in Three Ways
Eating patterns shift over time in response to changes in relative food prices and income levels, exposure to new cuisines and food products, and evolving dietary advice. It is difficult to know exactly how eating patterns are changing because time series data on actual consumption by Americans are lacking. Although extensive food expenditure data are regularly collected, good intentions in the grocery store do not always equate to what is eaten. Surveys may undercount some foods, such as when consumers “forget” their extra helpings and snacks. In addition, most consumer surveys of dietary intake cover only one or a few years of consumption and many are not nationally representative. So how do we track consumption patterns over time? ERS has been calculating the amount of food commodities available for consumption for decades. ERS’s data system has continued to expand and now consists of three data series. Users can download spreadsheets from all three data series. The Food Availability data series can also be accessed via the custom query feature to develop tables or charts for specific food groups, individual commodities, and years.
Food Availability
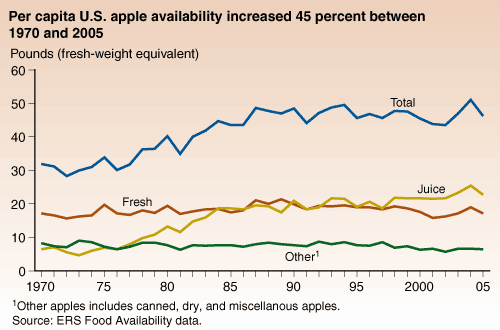
The first series, the core Food Availability data, is the only time series data on the amount of food available for consumption in the U.S. It is a continuous series extending back to 1909 for many commodities. The data are calculated for each food or commodity (e.g., beef, low-fat milk, and fresh broccoli) as the sum of annual production, beginning stocks, and imports minus exports, ending stocks, and nonfood uses. Per capita estimates are calculated by dividing the total annual food supply of a commodity by the U.S. population that year. Although the series does not directly measure actual quantities ingested, it provides an indication of whether Americans, on average, are consuming more or less of various foods over time. For example, in 2005, per capita apple availability reached 46 pounds, 45 percent above the 1970 level. These 46 pounds include fresh apples as well as apples used for juice and other processed products. The availability data do not account for spoilage and waste in the marketing system and at home. Thus, the data typically overstate actual consumption.
Loss-Adjusted Food Availability
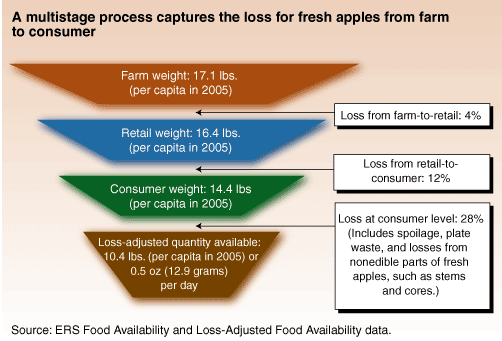
In the mid-1990s, ERS developed methods to adjust the availability data for spoilage and other losses and to convert the data to food servings for comparison with Federal dietary recommendations. For each commodity or food, this second series—the Loss-Adjusted Food Availability data—subtracts the estimated amount of food lost due to spoilage and other factors at three stages. These losses vary by commodity. For example, loss at all levels for fresh apples totals an estimated 39 percent, while total loss for cheddar cheese is estimated at 18 percent. Efforts to refine the loss adjustments are under way.
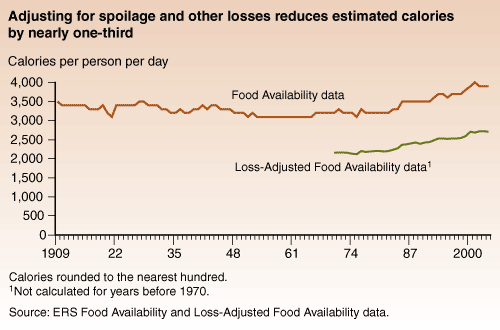
Next, the loss-adjusted data are converted from pounds per capita per year into daily per capita food intake in two forms—food servings (as identified in USDA’s MyPyramid Food Guidance System) and calories per person per day. Per capita servings for individual commodities are estimated and aggregated to determine total daily servings for each food group. Calories are likewise aggregated. These estimates are then compared with recommendations for the U.S. population.
Nutrient Availability
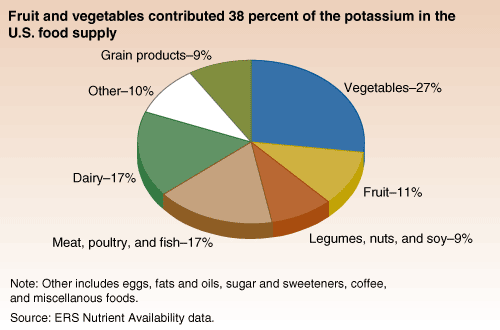
The third series, the Nutrient Availability data, is compiled by USDA’s Center for Nutrition Policy and Promotion (CNPP) using the Food Availability data. This historical data series estimates the amounts per capita per day of food energy (calories), as well as 27 nutrients and dietary components (i.e., protein, carbohydrates, fats, vitamins, and minerals) in the Nation’s food supply. Such information lets nutritionists and others know which food groups are supplying which nutrients. For example, vegetables contributed 27 percent and fruit 11 percent of the potassium in food available for consumption in 2004.
This article is drawn from:
- Food Availability (Per Capita) Data System. (n.d.). U.S. Department of Agriculture, Economic Research Service.
You may also like:
- Food Availability (Per Capita) Data System. (n.d.). U.S. Department of Agriculture, Economic Research Service.


