Promising Economic Outlook for Agricultural Sector Continues in 2007
- by Mitch Morehart and James Johnson
- 2/1/2007
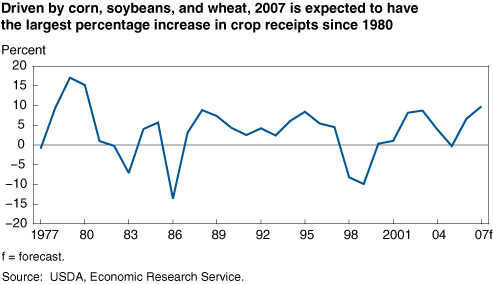
As producers gather their marketing plan information together for a year-end evaluation and future business planning, the overall financial picture looks promising for farmers and ranchers in 2007. The planning environment, however, may have more uncertainties than in recent years. The continued emergence of biofuels, particularly ethanol, has stimulated corn prices and created uncertainty across the grain complex. Price expectations for corn are reminiscent of those in 1996, the last time the ending stocks-to-use ratio fell below 8 percent. Uncertainty over acreage shifts has also stimulated price increases for soybeans and, to a lesser extent, for other crops, such as wheat, where ending stocks are not as tight. Overall, crop receipts are forecast to reach a new nominal record of $133.5 billion in 2007, an increase of $11.9 billion over 2006. This would be the largest year-over-year percentage increase in crop receipts since 1980. The escalation in receipts, however, is concentrated among a few crops. Nearly two-thirds ($7.6 billion) of the increase in crop receipts are expected to come from corn. Wheat and soybeans together will account for another $2.7 billion (23 percent) of the increase.
Higher prices for many of the program commodities mean fewer government transfer payments for programs that are price-dependent (counter-cyclical payments, loan deficiency payments, marketing loan gains, and certificate exchange gains). In 2007, payments under these programs are forecast at $2.4 billion, down from $6 billion in 2006 and over $11 billion in 2005. As a result, total government payments are forecast to be $12.4 billion in 2007, the lowest amount since 2002. Receipts from the marketplace are expected to make a larger contribution to the incomes of farmers and ranchers in 2007. Government payments as a proportion of net cash income are one indication of the importance of payments as a source of income. This ratio is forecast at a near record-low 18 percent for 2007. In comparison, the highest value for payments as a share of net cash income occurred in 2000 when it reached 40 percent.
In 2007, total agricultural production expenses are forecast to increase by $13.5 billion (5.7 percent). This would be the fourth consecutive year of more than 5-percent increases in expenses and the second largest percentage increase, exceeded only by the energy-driven rise in 2005. The largest increase forecast for an individual component of production expenses is a 13-percent increase in feed costs. After 7 consecutive years of increases, expenses for fuels and oils are forecast to decline slightly but will remain well above levels experienced earlier in the decade.
The outlook for commodity market receipts, production expenses, and government payments translates into a net value added to the U.S. economy in 2007 of $118.5 billion. This would be $10 billion below the record in 2004 but well above the previous 10-year average of $100.7 billion. Net value added is a measure of the income earned by those contributing resources to agricultural production. The major stakeholders, which include hired labor, nonoperator landlords, and agricultural lenders, are expected to receive nearly $52 billion as a return on their contribution to production agriculture. The remainder, $66.6 billion, is referred to as net farm income and represents the farm operator's share of income from the sector's production activities. At this level, net farm income in 2007 would be $6 billion higher than in 2006 and $9 billion above the previous 10-year average. Net cash income, unlike net farm income, does not include the value of home consumption, changes in inventories, capital replacement, and implicit rent and expenses related to the farm operator's dwelling—none of which reflect cash transactions during the current year. It represents funds that are available to farm operators to meet family living expenses and make debt payments. The 2007 forecast shows a $500-million increase in net cash income from 2006—nearly $3 billion higher than the previous 10-year average of $64.6 billion.
Projected changes in net cash income vary widely by commodity specialization. Farms that specialize in the production of mixed cash grains, wheat, and corn are projected to have their highest average net cash incomes of this decade after increases of 17 to 29 percent over 2006 levels. In contrast, average net cash incomes are forecast to decline for specialty crop producers by 9 percent and farms that specialize in cotton and rice by almost 4 percent from their 2006 levels. The only projected increase in average net cash income among livestock producers in 2007 is for poultry, although at 1.5 percent, it would be a relatively small increase over 2006. The largest decline is forecast for hog producers at 19 percent.
This article is drawn from:
- Farm Sector Income & Finances. (n.d.). U.S. Department of Agriculture, Economic Research Service.
- Farm Household Well-being. (n.d.). U.S. Department of Agriculture, Economic Research Service.


