Indicators
- Contact: Website Administrator
- 2/1/2007
| 2003 | 2004 | 2005 | 2006 | 2007 | 2003-04¹ | 2004-05¹ | 2005-06¹ | 2006-07¹ | |
|---|---|---|---|---|---|---|---|---|---|
| Cash receipts ($ billion) | 215.5 | 237.9 | 238.9 | 242.7 | 258.7f | 10.4 | 0.4 | 1.6 | 6.6 |
| Crops | 109.9 | 114.3 | 114.0 | 121.6 | 133.5f | 4.0 | -0.3 | 6.6 | 9.8 |
| Livestock | 105.6 | 123.6 | 125.0 | 121.2 | 125.2f | 17.0 | 1.1 | -3.1 | 3.3 |
| Direct government payments ($ billion) | 16.5 | 13.0 | 24.3 | 16.3 | 12.4f | -21.2 | 86.9 | -32.8 | -23.8 |
| Gross cash income ($ billion) | 247.8 | 267.8 | 280.9 | 277.1 | 289.8f | 8.1 | 4.9 | -1.4 | 4.6 |
| Net cash income ($ billion) | 70.0 | 81.5 | 81.2 | 66.7 | 67.2f | 16.4 | -0.4 | -17.9 | 0.8 |
| Net value added ($ billion) | 102.0 | 128.9 | 120.4 | 109.7 | 118.5f | 26.4 | -6.6 | -8.9 | 8.0 |
| Farm equity ($ billion) | 1,182.7 | 1,380.1 | 1,589.6 | 1,693.2 | 1,759.0f | 16.7 | 15.2 | 6.5 | 3.9 |
| Farm debt-asset ratio | 14.2 | 12.9 | 11.9 | 11.8 | 11.8f | -9.2 | -7.9 | -1.0 | 0.1 |
| Farm household income ($/farm household) | 68,597 | 81,596 | 81,420 | 79,851 | 81,588f | 18.9 | -0.2 | -1.9 | 2.2 |
| Farm household income relative to average U.S. household income (%) | 116.1 | 134.8 | 128.5 | NA | NA | 16.1 | -4.7 | NA | NA |
| Nonmetro-metro difference in poverty rates (%points)2 | 2.1 | NA | 2.3 | NA | NA | NA | NA | NA | NA |
| Cropland harvested (million acres) | 315 | 312 | 312p | NA | NA | -1.0 | 0.0 | NA | NA |
| USDA Conservation Program expenditures ($ billion) | 4.3 | 5.1 | NA | NA | NA | 18.6 | NA | NA | NA |
| 1Annual percent change. 2Based on October-September fiscal years ending with year indicated. f = Forecast. p = Preliminary. NA = Not available. All dollar amounts are in current dollars. |
|||||||||
| 2003 | 2004 | 2005 | 2006 | 2007 | 2003-04¹ | 2004-05¹ | 2005-06¹ | 2006-07¹ | |
|---|---|---|---|---|---|---|---|---|---|
| U.S. gross domestic product ($ billion) | 10,961 | 11,713 | 12,456 | NA | NA | 6.9 | 6.3 | NA | NA |
| Share of agriculture and related industries in GDP (%) | 4.8 | 4.7 | 4.5 | NA | NA | -2.1 | -4.3 | NA | NA |
| Share of agriculture in GDP (%) | 0.8 | 1.0 | 0.8 | NA | NA | 19.2 | -16.3 | NA | NA |
| Total agricultural imports ($ billion)2 | 45.7 | 52.7 | 57.7 | 64.0 | NA | 15.3 | 9.5 | 10.9 | NA |
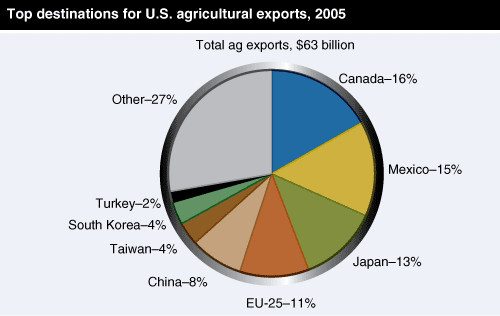
| Total agricultural exports ($ billion)2 | 56.0 | 62.4 | 62.5 | 68.7 | NA | 11.4 | 0.2 | 9.9 | NA |
| Export share of the volume of U.S. agricultural production (%) | 21.1 | 20.9 | 20.1p | NA | NA | -0.9 | -3.8 | NA | NA |
| CPI for food (1982-84=100) | 180.0 | 186.2 | 190.7 | 195.3 | NA | 3.4 | 2.4 | 2.4 | NA |
| Share of U.S. disposable income spent on food (%) | 9.8 | 9.7 | 9.9 | NA | NA | -1.0 | 2.1 | NA | NA |
| Share of total food expenditures for at-home consumption (%) | 52.0 | 51.5 | 51.5 | NA | NA | -1.0 | 0.0 | NA | NA |
| Farm-to-retail price spread (1982-84=100) | 225.6 | 232.1 | 239.2 | NA | NA | 2.9 | 3.1 | NA | NA |
| Total USDA food and nutrition assistance spending ($ billion)2 | 41.8 | 46.2 | 50.9 | 53.0 | NA | 10.5 | 10.2 | 4.1 | NA |
| 1Annual percent change. 2Based on October-September fiscal years ending with year indicated. f = Forecast. p = Preliminary. NA = Not available. All dollar amounts are in current dollars. |
|||||||||


