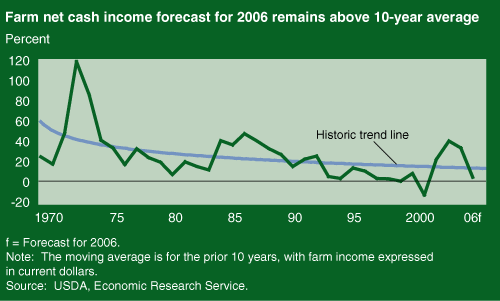
2006 Farm Net Cash Income Expected To Decline Slightly
- by Mitch Morehart and Jim Johnson
- 2/1/2007
Since about 1990, U.S. farm net cash income (earnings generated by production activities, which are available to pay debts and household living expenses) has been less volatile than in earlier decades. Strong demand for U.S. agricultural commodities is partly the result of rising populations and improving standards of living in many developing countries. In addition, technological advances have contributed to higher crop yields and helped tailor livestock products to better meet changing consumer tastes.
The combination of rising U.S. farm productivity and increasing demand for U.S. agricultural products has resulted in consistently higher net cash income over the last two decades. Farm net cash income has generally exceeded its 10-year moving average over the last 20 years. Between 2003 and 2005, farm earnings spiked well above the trend line for the first time since 1993, but they are expected to return to more recent historical levels in 2006.
Although down from the unprecedented 2004-05 period, farmers’ income prospects still look strong in the context of the past decade. The downward shift in 2006 income from 2005 will be hardest felt by dairy and hog producers. Both industries must contend with cost increases from energy-related inputs and rising feed costs at a time when high production levels are depressing market prices for their products. The lower farm earnings will have less impact on most households that operate residential and intermediate-sized farms because their incomes are derived mostly from off-farm sources. Incomes for households that run commercial-sized operations will be lower in 2006, but their average incomes will remain well above average incomes of other farm households.
Even more unusual than the sector’s income performance has been the continued increase in farm sector equity and the record-low debt-to-asset ratio. The two largest increases in equity in the last 20 years occurred during 2004 and 2005 (17 percent and 15 percent, respectively). Farm equity has increased in real terms for 15 consecutive years. Nearly $600 billion has been added to farm equity since 2002. The debt-to-asset ratio measures the relationship between claims of creditors on a business (debt capital) and assets of the business. In 2006, the debt-to-asset ratio is estimated to be 11.4, the lowest value since annual measurements began in 1960. The driving factor in the reduction in farm sector leverage has been the rise in farm asset values, principally real estate, which have grown by nearly 150 percent since 1989.
This article is drawn from:
- Agricultural Income and Finance Situation and Outlook. (2006). Economic Research Service. AIS-84..


