
Adjusting for Living Costs Can Change Who Is Considered Poor
- by Dean Jolliffe
- 11/1/2006
Highlights
- The prevalence of poverty has been greater in nonmetro than metro areas in every year since the 1960s when poverty rates were first officially recorded.
- Adjusting the official poverty measure for cost-of-living differences reverses the rankings of metro and nonmetro poverty.
- Such a reversal could have important implications for the geographic and demographic distribution of Federal funding of poverty-based programs.
- Listen to an interview with author Dean Jolliffe. (7 minutes, 14 seconds)
In 1960, the Census Bureau began recording poverty rates by area of residence across the U.S. Every year since then, the prevalence of poverty has been greater in nonmetropolitan (nonmetro) areas than in metropolitan (metro) areas. During the late 1960s, poverty in nonmetro areas was almost twice as high as in metro areas. This difference declined over time, and by the 1990s, the nonmetro poverty rate was between 12 and 30 percent higher than the metro rate. In 2003, 12.1 percent of the metro population was poor, while the poverty rate for nonmetro areas was 14.2 percent.
Poverty estimates figure prominently in the distribution of Federal and State assistance funds. More than 25 different Federal assistance programs link their eligibility criteria in part to poverty lines or rates. Given the higher rates of nonmetro poverty and the link between program eligibility and poverty, it follows that more Federal assistance funds per capita are distributed in nonmetro areas. For example, to receive food stamps, a household’s income must be equal to or less than 130 percent of the poverty line. In 2004, the Food Stamp Program distributed more than $24 billion in program benefits, and Current Population Survey data indicate that per capita benefits were 32 percent higher in nonmetro areas than metro areas. Overall, in 2001, the per capita distribution of Federal funds for income security programs was 17 percent higher in nonmetro than in metro areas.
The National Academy of Sciences has recommended several changes in how the Federal Government measures poverty. ERS examined one of these recommendations—adjusting for geographic differences in the cost of living—and found that such an adjustment would change the geographic distribution of poverty. Currently, the official Federal poverty thresholds assume that the cost of living is the same over the entire U.S. However, the Census Bureau has developed experimental poverty measures that use rent data to create an index for geographic differences in the cost of living. Using this index to adjust for differences in the cost of living reverses the ranking of metro and nonmetro poverty.
Cost of Living Varies Geographically
The major components of a low-income household’s budget are housing, food, transportation, and health care. The purpose of many assistance programs is to boost the purchasing power of needy Americans so they can purchase basic necessities and attain a minimum standard of living. The cost of purchasing many of the basic necessities—the cost of living—varies across the U.S. For Federal assistance programs to boost the purchasing power of program participants by similar amounts, regardless of where they live, it is necessary to account for cost-of-living differences.
The Census Bureau has developed a geographic cost-of-living index based on 2001 Fair Market Rent (FMR) data collected by the U.S. Department of Housing and Urban Development (HUD). FMR data provide full coverage of the U.S., including metro and nonmetro areas, and they reflect the costs of rent and utilities faced by lower income households (see box, “How the Index Is Constructed”). HUD produces annual estimates for 354 metro areas and 2,350 nonmetro counties. The cost-of-living index aggregates the FMR estimates to 100 different price levels, one for metro and one for nonmetro counties of each State plus the District of Columbia (NJ and DC have no nonmetro areas). For the index, metro counties are defined as any county that (1) contains a city with a population of at least 50,000, (2) has an urbanized area as defined by the Census Bureau, or (3) is adjacent to and economically tied to a metropolitan area.
The cost-of-living index is based on data from 2001 and consists of two components—housing and all other goods and services. The index assumes that variation in the FMR data across the U.S. reflects variation in housing costs for the poor. It also assumes that the prices of all other goods and services do not vary (see box, “What the Index Does Not Measure”). Housing is a critical component of the index because it is both the largest budget item for poor families and the most important source of cost-of-living differences in the U.S. Following the recommendations of the National Academy of Sciences, the index assigns a weight of 44 percent for housing expenses and 56 percent for all other goods and services. If the FMR data indicate that rents in a particular area are 10 percent higher than the baseline, then the cost of living in this area is assumed to be 4.4 percent higher than the baseline.
Adjusting for Living Costs Reverses Poverty Rates
The data used in this article are the 2001 cost-of-living index and the 1992-2003 March Supplement to the Current Population Survey (CPS). CPS data are the basis for the official U.S. poverty estimates and, in more recent years, provide information on more than 80,000 families in each year. The sample represents the civilian, noninstitutionalized population and members of the Armed Forces living either off base or with their families on base. The reference period for income-related questions is the preceding calendar year; therefore, the 1992-2003 CPS data provide poverty estimates for 1991 through 2002.
Income, following the Federal definition of poverty, includes all pre-tax income but does not include capital gains or noncash benefits, such as public housing, Medicaid, or food stamps. A person is poor if this measure of income is less than thresholds set by the U.S. Government. Poverty thresholds account for differences in need by setting different thresholds for families of varying sizes. So, for example, in 2001, a three-person family consisting of two adults and one child was poor if its family income was less than $14,255.
One way to account for cost-of-living differences is to adjust the poverty threshold by the cost-of-living index. For example, the index for metro Illinois is 1.08, which means that the three-person family threshold of $14,255 would be increased by 8 percent to $15,395. The index for nonmetro Florida is 0.90 which means that the three-person poverty threshold would decline to $12,830.
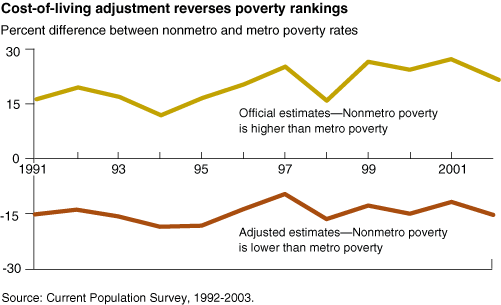
Following the official definition of poverty, 11.1 percent of the metro population was poor in 2001. For nonmetro areas, the poverty rate was 14.2 percent—about 28 percent higher. Once the poverty thresholds are adjusted using the cost-of-living index, this ranking reverses. The adjusted nonmetro poverty rate drops to 10.5 percent, and the adjusted metro rate increases to 12.0 percent. Where the official poverty rate indicates that the incidence of poverty is 28 percent higher in nonmetro areas, the poverty rate that is adjusted for cost-of-living differences suggests that the incidence of poverty is 12 percent lower in nonmetro areas.
The reversal of poverty rankings is not unique to 2001. Using the 2001 cost-of-living index for multiple years indicates that the reversal holds for every year considered (1991-2002). The use of the 2001 index assumes that the geographic variation in prices over the last decade has been somewhat stable. (This assumption is found to be reasonable from examining earlier years of FMR data.) In most of the years considered, the official nonmetro poverty rate has been more than 15 percent higher than the metro poverty rate. When adjusted for cost-of-living differences, the nonmetro poverty estimates are 10-25 percent less than the metro estimates.
Nonmetro Elderly Affected the Most
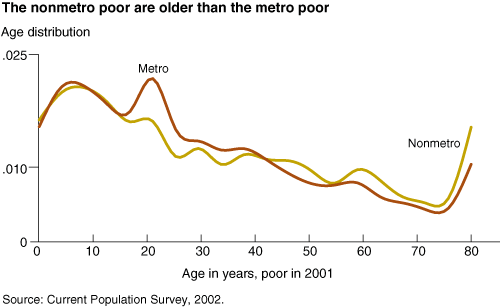
Previous research indicates that the nonmetro poor are somewhat older on average and more likely to be retired, while the metro poor are younger and more likely to be going to school. In 2001, the average age of the poor living in nonmetro areas was about 2 years greater than that of the metro poor. Similarly, 25 percent of the nonmetro poor were age 50 or older, compared with 20 percent of the metro poor.
In 2001, child poverty rates were higher in both metro and nonmetro areas than the poverty rates for other age groups. Children also comprised a greater share of the population of poor people in both metro and nonmetro areas. Differences in the age distribution of the poor across metro and nonmetro areas are seen in adults. A greater share of the metro poor falls in the age range of 18-40 years, while more of the nonmetro poor are middle-aged and elderly.
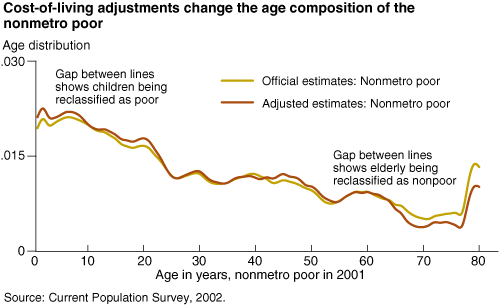
Adjusting for cost-of-living differences had a larger effect on the age composition of the nonmetro poor than the metro poor. A greater proportion of the nonmetro poor who are reclassified as nonpoor following the cost-of-living adjustment (those with incomes just below the poverty line) are older people. Forty-two percent of the nonmetro poor who are reclassified as nonpoor are over 40 years old. Among the metro poor, 33 percent of those reclassified as nonpoor are over 40.
Adjustment in Poverty Measures Could Shift Program Funds
With no adjustment for cost-of-living differences, the prevalence of poverty is consistently higher in nonmetro than in metro areas. When the index is used to adjust for cost-of-living differences, poverty is higher in metro than in nonmetro areas. The adjustments would reduce the nonmetro poverty population in 2001 (and increase the metro poverty population) by 1.9 million people. Given the large number of Federal assistance programs that tie eligibility criteria to poverty, adjusting the official definition of poverty to incorporate cost-of-living differences could have important implications for the distribution of Federal funds. In particular, one would expect to see more funds targeted to people living in metro areas and fewer funds targeted to nonmetro areas.
Adjusting for cost-of-living differences would also change the demographics of poverty. Currently, the nonmetro poor are disproportionately elderly, many of whom are living on fixed incomes near the poverty line. Adjusting for differences in the cost of living would result in reclassifying many of these elderly poor as nonpoor. Of the 1.9 million nonmetro poor who would be reclassified as nonpoor, 25 percent are age 60 or older. This adjustment could significantly affect Federal programs, such as Supplemental Security Income, Medicaid, the Child and Adult Care Food Program, and the Commodity Supplemental Food Program, as the number of elderly who qualify for these programs would be reduced.
This article is drawn from:
You may also like:
- Rural Poverty & Well-Being. (n.d.). U.S. Department of Agriculture, Economic Research Service.