Indicators
- Contact: Website Administrator
- 6/1/2006
| Annual percent change | |||||||||
|---|---|---|---|---|---|---|---|---|---|
| 2000 | 2001 | 2002 | 2003 | 2004 | 2005 | 2002-03 | 2003-04 | 2004-05 | |
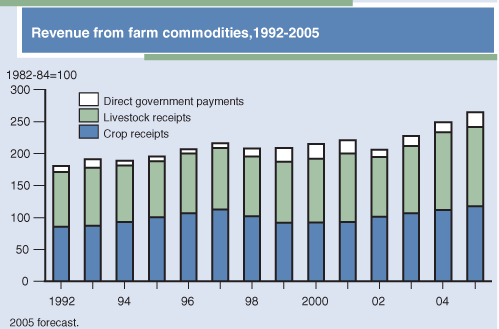
| Cash receipts ($ billion) | 192.1 | 200.1 | 195.0 | 216.6 | 241.2 | 239.0f | 11.1 | 11.4 | -0.9 |
| Crops | 92.5 | 93.3 | 101.0 | 111.0 | 117.8 | 114.1f | 9.9 | 6.1 | -3.1 |
| Livestock | 99.6 | 106.7 | 94.0 | 105.6 | 123.5 | 124.9f | 12.3 | 17.0 | 1.1 |
| Direct government payments ($ billion) | 22.9 | 20.7 | 11.2 | 17.2 | 13.3 | 23.0f | 53.6 | -22.7 | 72.9 |
| Gross cash income ($ billion) | 228.7 | 235.6 | 221.0 | 249.5 | 271.7 | 279.5f | 12.9 | 8.9 | 2.9 |
| Net cash income ($ billion) | 56.7 | 60.1 | 49.5 | 71.6 | 85.5 | 82.8f | 44.6 | 19.4 | -3.2 |
| Net value added ($ billion) | 91.9 | 95.0 | 78.6 | 101.2 | 125.9 | 119.3f | 28.8 | 24.4 | -5.2 |
| Farm equity ($ billion) | 1,025.6 | 1,070.2 | 1,110.7 | 1,180.8 | 1,293.9 | 1,376.9f | 6.3 | 9.6 | 6.4 |
| Farm debt-asset ratio | 14.8 | 14.8 | 14.8 | 14.4 | 13.8 | 13.4f | -2.7 | -4.2 | -2.9 |
| Farm household income ($/farm household) | 61,947 | 64,117 | 65,761 | 68,597 | 81,480p | 83,461f | 4.3 | 18.8 | 2.4 |
| Farm household income relative to average U.S. household income (%) | 108.6 | 110.2 | 113.7 | 116.1 | 134.6p | na | 2.1 | 15.9 | na |
| Nonmetro-metro difference in poverty rates (%points) | 2.6 | 3.1 | 2.6 | 2.1 | na | na | -19.2 | na | na |
| Cropland harvested (million acres) | 314 | 311 | 307 | 315 | 312 | 312p | 2.6 | -1.0 | 0.0 |
| USDA Conservation Program expenditures ($ billion)1 | 3.3 | 3.7 | 4.2 | 4.3 | 5.1 | na | 2.4 | 18.6 | na |
| f= Forecast. p = Preliminary. na = Not available. All dollar amounts are in current dollars. 1 Based on October-September fiscal years ending with year indicated. |
|||||||||
| Annual percent change | |||||||||
|---|---|---|---|---|---|---|---|---|---|
| 2000 | 2001 | 2002 | 2003 | 2004 | 2005 | 2002-03 | 2003-04 | 2004-05 | |
| U.S. gross domestic product ($ billion) | 9,817 | 10,128 | 10,470 | 10,971 | 11,734 | 12,487 | 4.8 | 7.0 | 6.4 |
| Share of GDP in agriculture and related industries (%)1 | 4.8 | 4.8 | 4.8 | 4.8 | 4.8 | na | 0.0 | 0.0 | na |
| Share of GDP in agriculture (%)1 | 0.7 | 0.7 | 0.7 | 0.8 | 1.0 | na | 11.1 | 19.2 | na |
| Total agricultural imports ($ billion)2 | 38.9 | 39.0 | 41.0 | 45.7 | 52.7 | 57.7 | 11.5 | 15.3 | 9.5 |
| Total agricultural exports ($ billion)2 | 50.7 | 52.7 | 53.3 | 56.2 | 62.4 | 62.4 | 5.4 | 11.0 | 0.0 |
| Export share of the volume of U.S. agricultural production (%) | 17.6 | 17.6 | 16.7 | 17.9 | 16.3 | na | 7.2 | -8.9 | na |
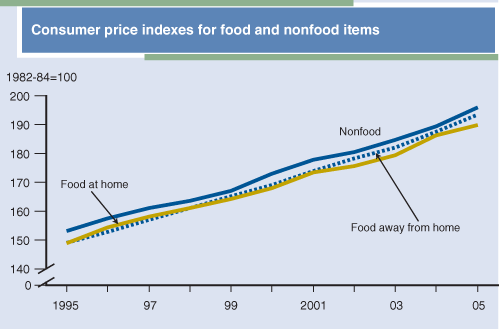
| CPI for food (1982-84=100) | 167.9 | 173.1 | 176.2 | 180.0 | 186.2 | 190.7 | 2.2 | 3.4 | 2.4 |
| Share of U.S. disposable income spent on food (%) | 9.8 | 9.8 | 9.5 | 9.4 | 9.5 | na | -1.1 | 1.1 | na |
| Share of total food expenditures for at-home consumption (%) | 51.7 | 51.7 | 50.8 | 50.3 | 49.7 | na | -1.0 | -1.2 | na |
| Farm-to-retail price spread (1982-84=100) | 210.3 | 215.4 | 221.2 | 225.6 | 232.1 | 238.3 | 2.0 | 2.9 | 2.7 |
| Total USDA food and nutrition assistance spending ($ billion)2 | 32.6 | 34.2 | 38.0 | 41.8 | 46.2 | 50.9 | 10.0 | 10.5 | 10.2 |
| na = Not available. All dollar amounts are in current dollars. 1 The methodology for computing these measures has changed. These statistics are not comparable to previously published statistics. Sources and computation methodology are available at: http://www.ers.usda.gov/amber-waves/about/methodology-notes.aspx 2 Based on October-September fiscal years ending with year indicated. |
|||||||||


