Farm Cash Margins Expected to Tighten in 2006
- by Mitch Morehart and James Johnson
- 2/1/2006
Net income and value-added to the U.S. economy from farming is projected to be less in 2006 than in the previous year. Lower income and higher expenses are predicted, with no one change being the dominant reason for lower earnings. Purchased inputs are forecast to be $4.9 billion higher in 2006; energy-based inputs such as fuel and fertilizer, repairs, and other miscellaneous expenses account for over four-fifths of the increase. Payments to laborers, creditors, and landlords are forecast at a record $49 billion, with most of the increase over 2005 accounted for by interest payments and rising labor costs.
Both crop and livestock production values are projected to be just over 2 percent less than in 2005. Feed and oil crops will contribute most to the reduction, due to both lower prices and production. Lower livestock values are expected to stem from declines in the dairy and hog sectors. Government payments to farmers and landowners are also forecast to be about $4.5 billion less in 2006.
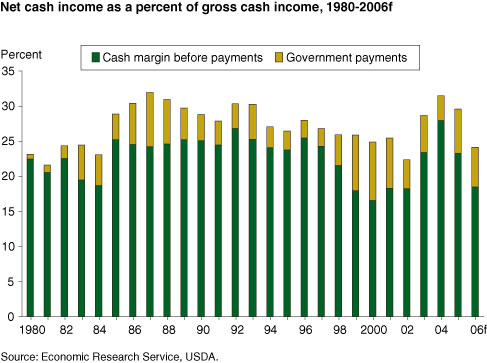
Net cash income, the difference between farming’s gross cash income and cash expenditures for production inputs, is forecast to be $64.8 billion in 2006, following the record of $85.5 billion in 2004 and $82.8 billion in 2005. Net income from farm production and farm-related economic activities is forecast to be $56.2 billion, just above its 10-year average of $55.7 billion. Still, this would be the fifth highest net farm income ever recorded. Both U.S. crops and livestock had record setting years for value added and receipts in 2004-05.
Income outlook and financial circumstances vary among farms
Lower prices, reduced marketings, lower government payments, and higher input costs could reduce the incomes of all farms, but especially those that specialize in program crops such as corn, soybeans, and wheat. Energy-based inputs and interest, items expected to increase the most in 2006, account for about 40 percent of costs in grain, oilseed, and cotton production. Even though earnings are expected to decline in 2006, farm business income could remain well above the previous 5-year average for soybean and peanut producers, and might nearly match the 5-year average for rice and cotton producers. The combined effects of a cost-price squeeze and lower government payments may fall hardest on wheat farms, whose operating margins have shrunk since 2003.
Livestock operations, other than dairy, are projected to have smaller reductions in income than for program crop farms. In contrast with program crop farms, price declines are forecast to be smaller, and quantities marketed are forecast to be higher than in 2005, which should provide more of a cushion against projected higher operating costs. In addition, fuel, fertilizer, and interest charges are a much smaller component (13-15 percent) of total expenses on livestock farms. The largest reduction in income (39 percent) among livestock operations is projected for dairy farms.
Asset Values, Equity, and Debt Levels Rise
Even though farm income is expected to decline in 2006 from the record high levels of 2004-05, farm business assets, debt, and equity values should continue to rise. The value of farm assets is forecast to gain 5 percent over 2005's forecast of $1.59 trillion. The value of farm real estate, accounting for more than 80 percent of farm assets, is expected to increase by 6 percent. The rate of increase is expected to slow in 2006, and return to the 4- to 5-percent range typical since the mid-1990s (prior to the recent boom).
Farm business debt is expected to rise 3 percent in 2006, approaching $123 billion by year end. Sector equity (net worth) is expected to rise more than 5 percent, as, in dollar terms, the gain in asset values exceeds the increase in debt levels by about $76 billion. Farm business balance sheets have stabilized over the last 15 years. Debt-to-asset ratios have ranged between 15 and 16 percent since 1993, as increases in debt typically have been offset by larger gains in farm asset values. Because farm real estate values have risen faster than farm mortgage debt, the degree to which farmland is leveraged has declined slightly. This has provided farm investors with an added equity cushion to lessen the impact of any short-term declines in income or asset values. Since 2003, farm sector equity has increased by 23 percent, adding nearly $272 billion in wealth to farm operators and land owners.
Cash Operating Margins Will Remain Relatively Tight
Longer-term production and price projections suggest that net cash income from farming will not be sustained at the record levels of 2004-2005, but will settle in the low to mid-$60-billion range. Receipts, although projected to rise, are not likely to keep pace with increases in production costs. Projections for all sources of revenue, including government payments, indicate that total cash sources of income will increase slower than receipts, suggesting that farming will earn a larger share of income from market sources. Gross income is projected to increase slower than production costs, keeping pressure on operating margins and farm profitability. Tighter operating margins than in recent years will place a premium on farmers’ ability to manage resources and adjust to economic conditions.
This article is drawn from:
- Agricultural Baseline. (n.d.). U.S. Department of Agriculture, Economic Research Service.
- Farm Sector Income & Finances. (n.d.). U.S. Department of Agriculture, Economic Research Service.
- Farm Household Well-being. (n.d.). U.S. Department of Agriculture, Economic Research Service.


