How Americans Quench Their Thirsts
- by Annette Clauson
- 9/1/2005
Grocery store shelves are filled with nonalcoholic beverages that vary widely in taste, calorie content, and nutritional makeup. Consumers choose which beverages to purchase based on their income and product prices, as well as individual preferences that are shaped by factors like age, education, and race/ethnicity. These choices have important implications for diet and health.
ERS researchers recently used ACNielsen Homescan data to examine how socioeconomic variables affect the mix of beverages purchased. Specifically, the study focused on purchases of milk, isotonics (sports drinks), bottled water, fruit juices and drinks, coffee, tea, carbonated soft drinks, and powdered soft drinks (Kool-Aid type drinks) from retail stores. (Beverages bought in restaurants or other away-from-home eating places were not examined.) Purchases like coffee, tea, and powdered drink mixes were converted into ready-to-drink equivalents to compare quantities. Although the study used 1999 purchase data, food consumption trends change slowly over time—ERS's 2003 food consumption data show similar patterns. Carbonated soft drinks were bought most heavily, followed by coffee, milk, and powdered soft drinks.
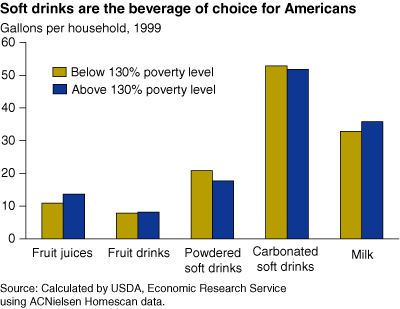
Researchers contrasted purchases of higher income households (incomes above 130 percent of the poverty level) with purchases of lower income households (incomes below 130 percent of the poverty level). Lower income households bought more powdered soft drinks (21 gallons per household in 1999 vs. 18 gallons) and tea (16 gallons vs. 15 gallons) and less milk (33 gallons vs. 36 gallons) and fruit juices (11 gallons vs. 14 gallons). The beverages for which the lower income households had higher purchases were cheaper: The Homescan households paid $0.96 per gallon for powdered soft drinks and $1.81 per gallon for tea, while they paid $3.06 per gallon for milk and $4.40 per gallon for fruit juices. The more affordable beverages contained more calories and caffeine and less calcium and vitamin C. Lower income and higher income households bought roughly the same amount of fruit drinks (about 8 gallons) and carbonated soft drinks (about 52 gallons).
Racial differences exist as well, with Black households buying more powdered soft drinks than other racial groups. Also, households headed by a female without a high school degree bought more powdered soft drinks than other households.
Researchers also examined the contribution of nonalcoholic beverages to nutrient intake by calculating per capita amounts of selected nutrients available from beverage purchases. Averaged across households in the survey, at-home beverage purchases provided 10 percent of daily calories (based on a standard of 2,000 calories), about 20 percent of the recommended daily intake of calcium, and close to 70 percent of the recommended daily intake of vitamin C.
This article is drawn from:
- Capps, Jr., O., Clauson, A., Guthrie, J., Pittman, G. & Stockton, M. (2005). Contributions of Nonalcoholic Beverages to the U.S. Diet. U.S. Department of Agriculture, Economic Research Service. ERR-1.


