Data Feature
- by James M. MacDonald, Robert A. Hoppe and David Banker
- 2/1/2005
Growing Farm Size and the Distribution of Commodity Program Payments
Structural changes within the farm sector can alter how benefits from government commodity programs are distributed, even without changes in government policy. One element of change, the shift of agricultural production toward large family-operated farms, has had a sizeable impact on how government commodity program payments are spread among farm households. Data from USDA's Agricultural Resource Management Survey (ARMS) and its predecessor, the Farm Costs and Returns Survey (FCRS), were applied to a classification that sorts family farms among five size classes, based on annual sales expressed in 2002 dollars (using the Producer Price Index for Farm Products), with all nonfamily farms assigned to a sixth class.
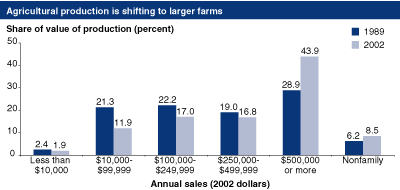
Agricultural production is shifting toward larger farms.
Farms in the largest sales class (at least $500,000 in 2002 dollars) accounted for 43.9 percent of production in 2002, up from 28.9 percent in 1989, the earliest year with consistent data. There were 64,000 farms in that size class in 2002, up from 32,000 in 1989. The trend to larger farms is sectorwide, with production of poultry, livestock, and crops all shifting to larger operations. Large farms have lower costs of production, on average, and they may realize higher commodity prices as well. Because large family farms tend to be more profitable, their share of production is expected to continue to expand.
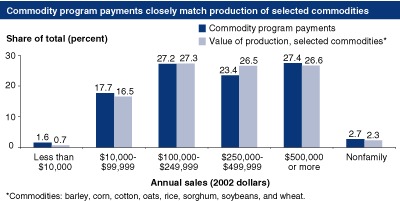
Commodity program payments are proportional to production of certain commodities...
Commodity program payments include all commodity and disaster assistance payments, and exclude environmental payments (such as those related to the Conservation Reserve Program). These payments are closely tied to a farm's production history for certain commodities. For example, family farms with sales between $100,000 and $249,999 received 27.2 percent of commodity program payments in 2002, and accounted for 27.3 percent of the value of production of eight selected commodities—barley, corn, cotton, oats, rice, sorghum, soybeans, and wheat.
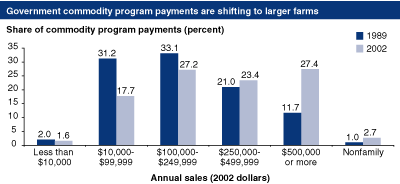
...And hence are shifting to larger farms...
Government commodity program payments shifted to the largest farms as those farms expanded their share of commodity production. Farms with at least $500,000 in sales received 27.4 percent of all commodity program payments in 2002, up from 11.7 percent 13 years earlier.
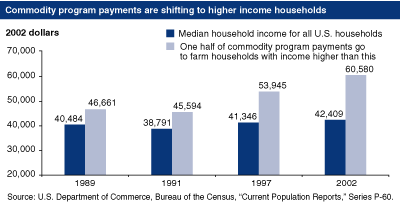
...And higher income households...
Operators of the largest farms earn higher household incomes, on average, than operators of other farms, so production shifts have caused commodity program payments to move to higher income households. In 1989, half of all commodity payments went to households with incomes below $46,661 (in 2002 dollars), and half went to households with higher incomes. The median income among all U.S. households in 1989 was $40,484. But by 2002, the farm household income that split the distribution of commodity program payments in half had risen sharply, to $60,580. That growth was much greater than the corresponding growth in median U.S. household income ($42,409 in 2002). No explicit change in farm policy drove this shift; rather, structural changes in farming altered the link between programs and beneficiaries.
...with the largest shifts at the highest incomes.
By 2002, farm households with incomes of $200,000 or more (measured in 2002 dollars) received 14.5 percent of all commodity program payments, up from 9.3 percent in 1989, while households with incomes between $100,000 and $200,000, as well as nonfamily operators, also received larger shares of commodity payments. Households with incomes under $100,000 saw their shares of total commodity program payments fall.
This article is drawn from:
- ARMS Farm Financial and Crop Production Practices. (n.d.). U.S. Department of Agriculture, Economic Research Service.
You may also like:
- Farm Structure and Organization. (n.d.). U.S. Department of Agriculture, Economic Research Service.


