Persistent Poverty Is More Pervasive in Nonmetro Counties
- by Dean Jolliffe
- 9/1/2004
During the 1990s, America experienced unprecedented economic growth, and the national poverty rate declined from a decade high of over 15 percent in 1993 to a low of 11.3 percent in 2000. A brief recession in 2001 led to an increase in poverty, with the most recent estimates indicating that just over 12 percent of the American population was poor in 2002. Not only is the poverty rate an important social indicator of the well-being of the least well off, but it is also a primary input for shaping many Federal policies and targeting program benefits.
Poverty is not distributed equally across the United States. Although most of the Nation’s poor live in metropolitan (metro) areas, poverty rates have been consistently higher in nonmetropolitan (nonmetro) areas in every year since the 1960s, when poverty rates were first officially recorded. Even with similar patterns of change in poverty rates over time, a metro-nonmetro gap in poverty rates persists. In the 1980s, the average incidence of poverty was 4.4 percentage points higher in nonmetro areas than in metro areas. During the 1990s, the gap declined and the average difference fell to 2.6 percentage points.
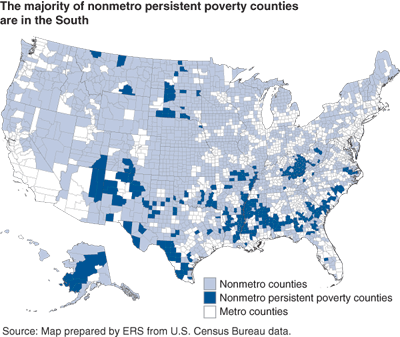
Time is an important dimension of poverty: Someone who is poor today but not tomorrow may be better off than someone who is poor today and poor tomorrow. To shed light on this aspect of poverty, ERS defined counties as being persistently poor if 20 percent or more of their populations were living in poverty over the last 30 years (measured by the 1970, 1980, 1990, and 2000 decennial censuses). This definition yielded 386 persistently poor counties in the U.S., representing 4 percent of the U.S. population. A majority (340 of 386) of the persistent-poverty counties are nonmetro counties. Persistent poverty is also more pervasive in the most rural areas, as seen in the share of counties that were persistently poor—4 percent of metro counties, 13 percent of micropolitan counties (the more urbanized nonmetro counties), and 18 percent of noncore, nonmetro counties (the most rural of nonmetro counties). (For more information on these classifications, see “Behind the Data” in Amber Waves, September 2003.)
A strong regional pattern of poverty and persistent poverty also emerges. No persistent-poverty counties are found in the Northeast, and only 60 of the nonmetro persistent-poverty counties are in the Midwest and West. The remaining 280 nonmetro persistent-poverty counties are in the South, comprising 25 percent of the total nonmetro population there. Furthermore, the nonmetro South, with over 40 percent of the U.S. nonmetro population, has a significantly higher incidence of poverty. Poverty estimates for 2002 indicate that, in the South, 17.5 percent of nonmetro residents were poor compared with 14.2 percent of all nonmetro residents. Understanding differences in poverty between nonmetro and metro areas of the U.S. is important to understanding differences in well-being across these areas and can help inform the policy dialogue on poverty reduction strategies.
This article is drawn from:
- Jolliffe, D. (2004). Rural Poverty at a Glance. U.S. Department of Agriculture, Economic Research Service. RDRR-100.


