Data Feature
- by John Hession
- 11/1/2004
Profiles of America: Demographic Data and Graphic Builder
Rural America, covering over 2,000 counties and 75 percent of the Nation’s land, is home to about 49 million people. The social and economic challenges facing rural areas differ greatly from those facing urban areas. Profiles of America: Demographic Data and Graphic Builder, a program now available on the ERS website, uses interactive tools to create maps, tables, and charts that display information on demographic trends, industrial structure, and the economic well-being of rural and urban communities. The program allows users to analyze rural and urban differences at the national, State, and county levels, and provides useful information to community leaders, Federal officials, and researchers.
Image
The program currently contains data from the Census Bureau, the Bureau of Economic Analysis, and the Bureau of Labor Statistics related to the socioeconomic status of the population and settlement patterns within the U.S. from 1990 to 2003. Data within the program are divided into eight broad topics: Population & Migration, Age & Sex, Race & Ethnicity, Educational Attainment, Households & Families, Journey to Work, Employment & Unemployment, and Income & Poverty. The program contains ERS classification systems, such as the rural-urban continuum code, the urban influence code, and the county typology (see “ERS Rural Indicators”), as well as about 100 individual variables from various data sources.
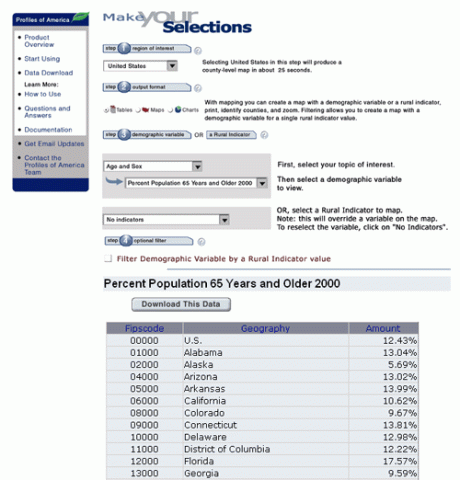
Upon entering the program, users are just a few clicks away from retrieving information presented in the form of a map, table, or chart, as shown in these partial screen shots. For example, a user—perhaps a Federal or community official interested in funding a nutrition education program targeted to the elderly—can quickly create a table showing that Florida has the highest share of the population 65 and over in 2000, 17.6 percent compared with the U.S. average of 12.4 percent.
Image
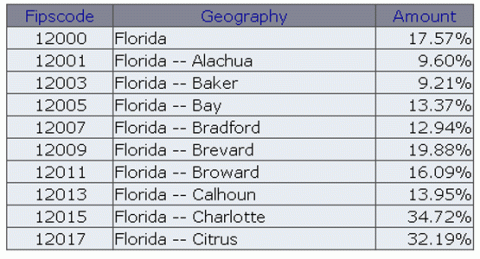
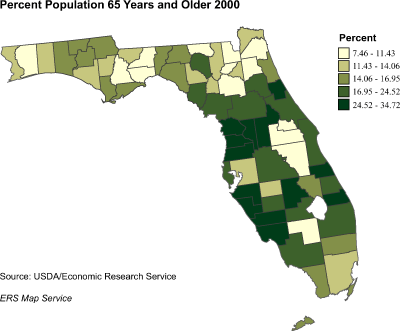
The user can then obtain greater detail and create a table showing the percentage of elderly for each county in Florida and determine that Charlotte has the highest percentage of elderly (34.7 percent) and Union the lowest (7.5 percent). The analysis can be further refined with the mapping function, which shows that the older population is heavily concentrated along the southwest coast and north-central areas of the State.
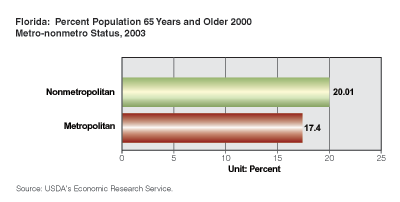
Because the economic and social character of rural places varies greatly across the United States, it may be even more instructive to use ERS’s rural indicators to capture this diversity for input to public policy and programs. Profiles of America can customize your data output accordingly. For example, some public programs specifically target funds to metro or nonmetro areas. The user can select one of ERS’s rural indicators and then chart any demographic variable by that indicator. Continuing with our example, nonmetro areas have a higher share (20.0 percent) of the population 65 and older than metro areas (17.4 percent).
Other functions are also available to help better understand socioeconomic trends and select the best way to display data. Printing, sorting, and the ability to download data to a personal computer for further analysis are available options. New indicators and features will be added in the future.