Data Feature
- by Timothy Parker
- 9/1/2003
New Insights on Metro and Nonmetro Areas
In recent years, nonmetropolitan (nonmetro) areas have become more socially and economically integrated with metropolitan (metro) areas. Still, newly released data from the 2000 Census of Population and Housing, along with new metropolitan area definitions, show nonmetro areas continue to lag metro areas in many respects. Nonmetro areas generally had higher poverty rates, fewer college graduates, lower average earnings, fewer full-time year-round jobs, and more low-skill jobs. Nonmetro areas, however, also have lower housing costs and more natural amenities.
The new metropolitan area classification (see Behind the Data) divides nonmetro areas into two categories: micropolitan (micro) areas and noncore (other nonmetro) areas. Micro areas are nonmetro areas with urban clusters of at least 10,000 persons. Noncore areas have no urban clusters of 10,000 or more persons. The new classification highlights the diversity within nonmetro areas. For example, micro areas have more college graduates and full-time workers, higher average earnings, and lower poverty rates than other nonmetro areas.
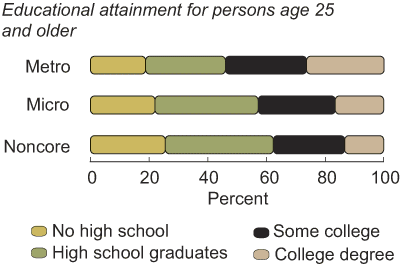
Nonmetro areas have fewer college graduates than metro areas
The share of persons with college degrees was almost twice as high in metro areas (26.4 percent) as in the most remote noncore areas (13.3 percent). Within nonmetro areas, micro areas had a slightly higher college completion rate (15.5 percent) than other nonmetro areas. Overall college completion rates have risen in the past decade, and the number of college graduates in nonmetro areas has increased nearly 40 percent. More college graduates implies a more highly skilled workforce and better paying jobs.
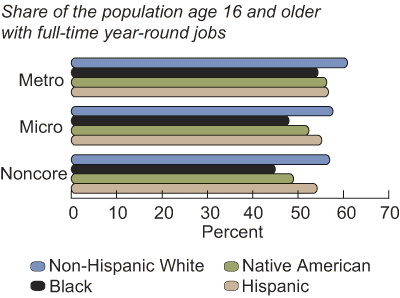
A smaller share of nonmetro workers are employed full-time year-round
The share of workers with full-time year-round jobs is lower in nonmetro areas than in metro areas, for all racial and ethnic groups. The lower nonmetro share reflects higher unemployment rates than in metro areas. Among nonmetro areas, however, micro areas fared better than noncore areas, with a higher share of workers employed full-time year-round. In general, nonmetro areas have more part-time work and seasonal jobs in agriculture and tourism industries.
Nonmetro areas have a lower share of jobs in management and professional occupations than metro areas
In metro areas, 37.8 percent of the workforce was employed in higher paying management and professional occupations, compared with 28.8 percent in micro areas and 27.8 percent in other nonmetro areas. Over 21 percent of metro workers were employed in sales and office occupations, compared with 17.4 percent in micro areas and 15 percent in noncore areas . Nonmetro areas have more jobs than metro areas in farming, construction, production, and transportation.
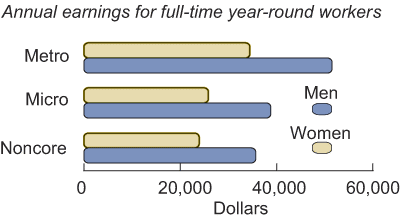
Average earnings are lower in nonmetro areas than in metro areas
Average annual earnings for full-time year-round workers are substantially lower in nonmetro areas than in metro areas for both men and women. Average earnings in metro areas ($44,635) were 24.4 percent greater than in micro areas ($33,738), and 30.3 percent greater than in noncore areas ($31,121). The ratio of women’s to men’s earnings was fairly constant across all areas. Women on average earned about 67 percent of men’s earnings.
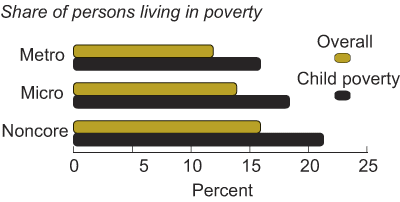
Nonmetro areas have higher poverty rates than metro areas
The overall poverty rate is significantly higher in nonmetro areas than in metro areas. The new nonmetro classification shows that poverty in micro areas (13.9 percent) was 2 percentage points higher than in metro areas, while the rate in noncore areas (15.9 percent) was 4 percentage points higher than in metro areas. The poverty rate for children was also significantly higher in nonmetro areas than in metro areas. The micro-noncore distinction will help anti-poverty programs better target areas of high poverty.
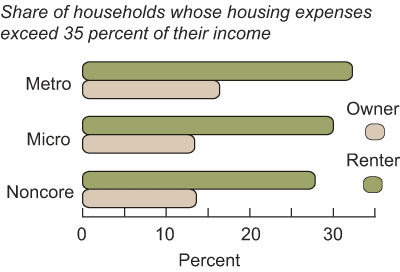
Housing expenses consume less of a household’s budget in nonmetro areas
Housing costs for both renters and homeowners are generally lower in micro and noncore areas than in metro areas. For metro households, 32.3 percent of renters and 16.4 percent of homeowners had housing expenses exceeding 35 percent of their gross household income. In contrast, 27.8 percent of renters and 13.6 percent of homeowners in noncore areas were in that situation.
You may also like:
- Rural Economy & Population. (n.d.). U.S. Department of Agriculture, Economic Research Service.


