Behind the Data: Estimating Per Capita Domestic Use of Head Lettuce
- Contact: Website Administrator
- 2/3/2003
- Domestic use of head (largely iceberg) lettuce is a proxy measure for actual consumption. Because annual consumption surveys are prohibitively expensive, indirect estimates of consumption are calculated to capture basic national consumption patterns and trends.
- Per capita (per person) domestic use does not directly measure what individuals eat, but is an estimate of the amount of raw commodity supplied to each person, based on the best available data.
- Analysts rely on domestic use data for such tasks as monitoring the Nation's food supply, studying the nutritional well-being of Americans, interpreting consumption trends among commodity groups, and conducting food demand research.
- Head lettuce includes iceberg, butterhead, Boston, and Bibb lettuces.
- Calculating per capita domestic use for fresh-market vegetables such as head lettuce is straightforward. U.S. imports are added to domestic production to arrive at total supply. U.S. exports are subtracted to yield net domestic use. Domestic use is divided by the July 1 estimate of U.S. population (including military) to arrive at the per-person proxy for consumption.
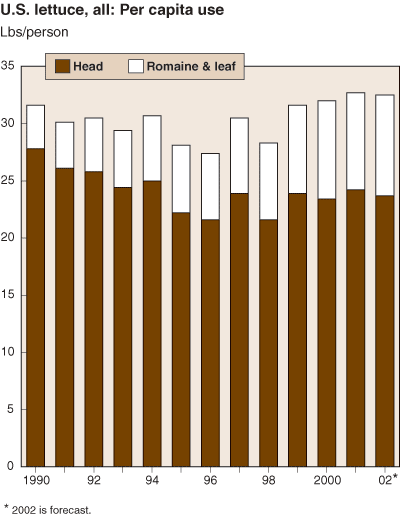
- Head lettuce accounts for 72 percent of all lettuce produced in the United States. In 2001, U.S. consumers had at their disposal 6.9 billion pounds (24.2 pounds per capita) of head lettuce. This included head lettuce sold in retail stores and various food service outlets such as restaurants and school lunches. It also included various bagged fresh-cut products.
- On average, more than 99 percent of all head lettuce consumed in the United States comes from domestic sources.
| Units | 2000 | 2001 | 2002f | |
|---|---|---|---|---|
| Harvested area1 | Acres | 184,900 | 193,600 | 194,500 |
| Per-acre yield1 | Cwt | 377 | 375 | 370 |
| Production1 | Mil lbs | 6,963 | 7,251 | 7,200 |
| Imports2 | Mil lbs | 32 | 46 | 98 |
| Total supply | Mil lbs | 6,995 | 7,297 | 7,298 |
| Exports2 | Mil lbs | 374 | 379 | 405 |
| Domestic use | Mil lbs | 6,621 | 6,918 | 6,893 |
| U.S. population3 | Thou. | 282,489 | 286,362 | 290,288 |
| Per capita use | Pounds | 23.4 | 24.2 | 23.7 |
| Season-average price | ||||
| Current dollars1 | $/cwt | 17.40 | 17.60 | 19.00 |
| Constant 1996 dollars4 | $/cwt | 16.28 | 16.08 | 17.12 |
| Share of supply exported | Percent | 5.3 | 5.2 | 5.5 |
| Share of use imported | Percent | 0.5 | 0.7 | 1.4 |
| f=ERS forecast. 1Source is NASS, USDA. 2Source is Census Bureau, U.S. Department of Commerce. 3July 1 estimate, including military population overseas. Source: Census Bureau, U.S. Department of Commerce. 4Deflated by the GDP implicit price deflator, 1996=100. |
||||