Behind the Data
- Contact: Website Administrator
- 4/1/2003
Estimating Consumption of Caloric Sweeteners
Since 1941, ERS has estimated annual U.S. total and per capita consumption of caloric sweeteners. The data series comprises dry-weight consumption estimates of refined cane and beet sugar, corn sweeteners, honey, and edible syrups.
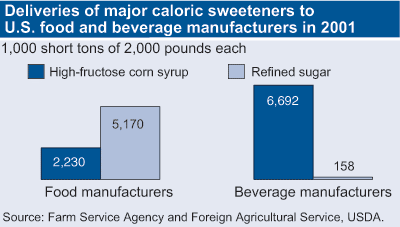
The estimates are based on deliveries of sweeteners by processors, refiners, and importers to U.S. food and beverage manufacturers, institutional users, wholesalers, and retailers. Food and beverage manufacturers use the sweeteners in processed products ranging from candy and soft drinks to catsup, yogurt, peanut butter, and boxed rice mixes. Food wholesalers and retailers distribute refined sugar, honey, maple syrup, and molasses for individual and household use.
ERS relies on estimates of refined cane and beet sugar deliveries published by USDA’s Farm Service Agency (FSA) in Sweetener Market Data. These estimates include sugar refined from domestic and imported raw sugar as well as refined sugar imports. As required by law (currently, the Farm Security and Rural Investment Act of 2002), all sugar beet processors and sugar cane refiners in the United States and Puerto Rico provide FSA with monthly reports on deliveries of refined sugar. USDA’s Foreign Agricultural Service provides FSA with estimates of refined sugar imports.
ERS estimates deliveries of corn sweeteners (high-fructose corn syrup, glucose, and dextrose) for domestic food and beverage uses (excluding nonfood uses), using information from industry contacts, consulting firms, and U.S. Census Bureau import data.
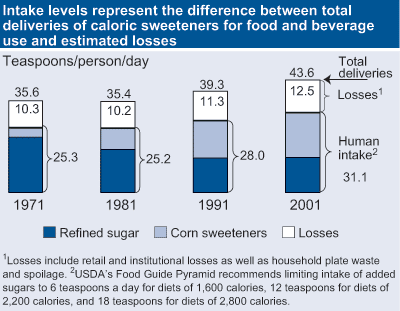
ERS divides total deliveries of various sweeteners by population to estimate per capita deliveries. Estimates of per capita delivery help determine whether Americans, on average, are consuming more or less added sugars over time. The delivery estimates, however, overstate the actual human intake of caloric sweeteners by not excluding amounts lost to human use through food spoilage, plate waste, and other losses in the home and marketing system. To obtain a measure of actual intake per capita, ERS subtracts estimated losses of caloric sweeteners from per capita deliveries. Average losses at the retail/institutional level total 11 percent, while those at the consumer level total 20 percent.
Estimates of per capita intake of caloric sweeteners made using this procedure may provide more accurate measures of average intake than estimates based on food intake surveys, particularly if some survey respondents underreport consumption of foods containing added sugars.
| Sweetener type | Annual deliveries: Volume (1,000 short tons) |
Annual deliveries: Share of total (Percent) |
Annual deliveries: Per capita (Pounds) |
Intake per capita¹: Annual (Pounds) |
Intake per capita¹: Daily (Tsp²) |
|---|---|---|---|---|---|
| Refined sugar | 9,201 | 43.8 | 64.6 | 46.0 | 13.6 |
| Corn sweeteners | 11,623 | 55.4 | 81.6 | 58.1 | 17.2 |
| High-fructose corn syrup | 8,922 | 42.5 | 62.6 | 44.6 | 13.2 |
| Glucose syrup | 2,231 | 10.7 | 15.7 | 11.1 | 3.3 |
| Dextrose | 470 | 2.2 | 3.3 | 2.3 | 0.7 |
| Honey | 135 | 0.6 | 0.9 | 0.7 | 0.2 |
| Edible syrups | 50 | 0.3 | 0.4 | 0.2 | 0.1 |
| Total | 21,008 | 100.0 | 147.4 | 105.0 | 31.1 |
| Totals may not add exactly due to rounding. Numbers are dry weight. 1Excludes losses averaging 11 percent at the retail/institutional level and 20 percent of the new subtotal at the consumer level (the two totaling to about 29 percent of initial deliveries). 2Daily intake in teaspoons = average annual intake in pounds / 365 days per year x 16 ounces per pound x 28.3495 grams per ounce / 4.2 grams per teaspoon. Tsp = Teaspoon. Source: USDA, Economic Research Service, Farm Service Agency, and Foreign Agricultural Service. |
|||||