ERS Charts of Note
Subscribe to get highlights from our current and past research, Monday through Friday, or see our privacy policy.
Get the latest charts via email, or on our mobile app for  and
and 

Wednesday, April 27, 2011
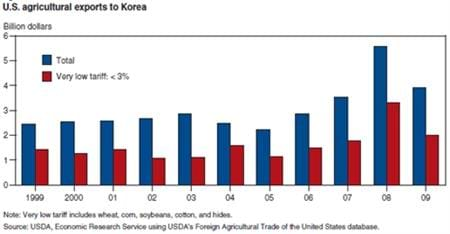
U.S. agricultural exports to Korea can be divided into two groups: inputs for Korean industries, and products that compete with the outputs of Korean industries. Some of the "input" goods include wheat, corn, soybeans, cotton, and hides used in processing that are imported with little or no tariff. This is because (1) they do not displace domestic Korean production, and (2) the industries that use them need low-cost inputs to compete in the Korean and global marketplaces. The products from which the United States could gain the most from a U.S.-Korea Trade Agreement include those: (1) where tariffs are currently high, (2) that are competitive with Korean producers, and (3) where Korean demand responds strongly to lower prices. This chart is from the ERS report, Selected Trade Agreements and Implications for U.S. Agriculture, ERR-115, April 2011.

Friday, April 15, 2011
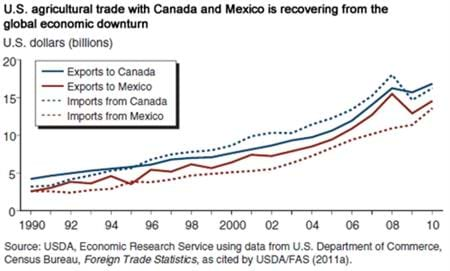
Agricultural trade within the NAFTA region is recovering from the recent global economic downturn. The total value (exports and imports) of U.S. agricultural trade with Canada and Mexico reached about $61.3 billion in 2010, compared with $60.7 billion in 2008 and $54.7 billion in 2009. Prior to the downturn, regional agricultural trade had enjoyed a long period of sustained growth with few interruptions. Even when accounting for the effects of the recent downturn, U.S. agricultural trade with Canada and Mexico has more than tripled since NAFTA's implementation in 1994. This chart is from the ERS report, NAFTA at 17: Full Implementation Leads To Increased Trade and Integration, WRS-11-01, March 2011.


