Description and Maps
County Economic Types, 2015 Edition
The following types are mutually exclusive. Each county in the U.S. is assigned one economic type.
- Farming-dependent
- Mining-dependent
- Manufacturing-dependent
- Federal/State government-dependent
- Recreation
- Nonspecialized
County Policy Types, 2015 Edition
The following types are not mutually exclusive. Counties may be none, one, or more policy type.
- Low education
- Low employment
- Persistent poverty
- Persistent child poverty
- Population loss
- Retirement destination
County Economic Types, 2015 Edition
The following types are mutually exclusive. Each county in the U.S. is assigned one economic type.
Errata: On May 31, 2017, the ERS 2015 County Typology Codes (non-overlapping economic types only) were revised for six counties to correct a coding error. The revised classifications are as follows: Pendleton, KY (mining-dependent); Alger, MI (Federal/State government-dependent); Hickory, MO (recreation); Washington, RI (Federal/State government-dependent); Leon, TX (mining-dependent); and Tucker, WV (Federal/State government-dependent).
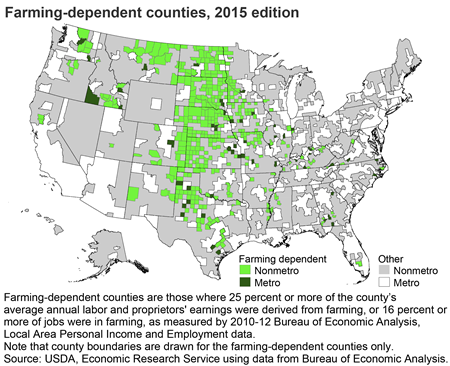
Farming-Dependent
Farming-dependent (444 total, 391 nonmetro) counties: either 25 percent or more of average annual labor and proprietors' earnings derived from farming during 2010-12 or 16 percent or more of county jobs were in farming in the same period. See the documentation for more information.
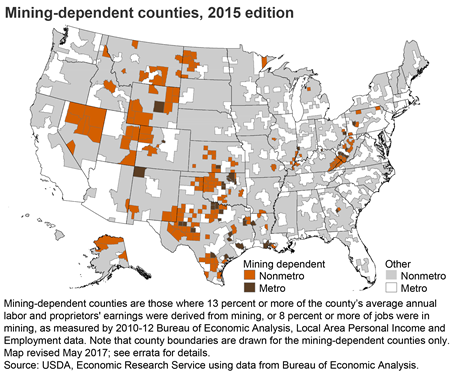
Mining-Dependent
Mining-dependent (221 total, 184 nonmetro) counties: 13 percent or more of average annual labor and proprietors' earnings derived or 8 percent or more of total employment during 2010-12.
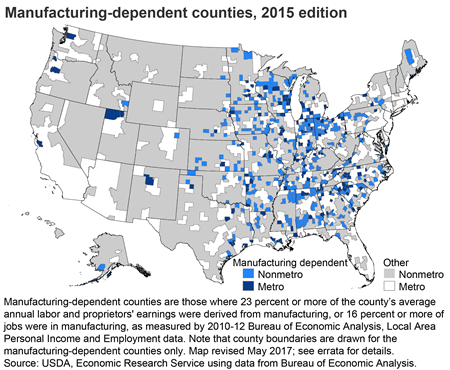
Manufacturing-Dependent
Manufacturing-dependent (501 total, 348 nonmetro) counties: 23 percent or more of average annual labor and proprietors' earnings derived from manufacturing or 16 percent of total employment during 2010-12.
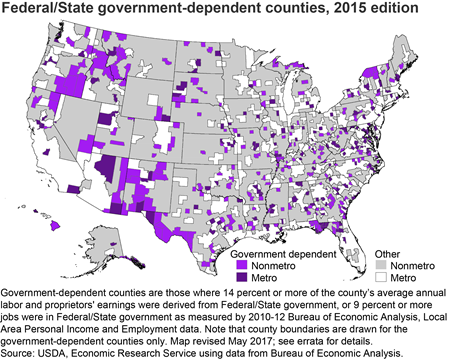
Federal/State Government-Dependent
Federal/State government-dependent (407 total, 239 nonmetro) counties: 14 percent or more of average annual labor and proprietors' earnings derived from Federal and State government or 9 percent of total employment during 2010-12.
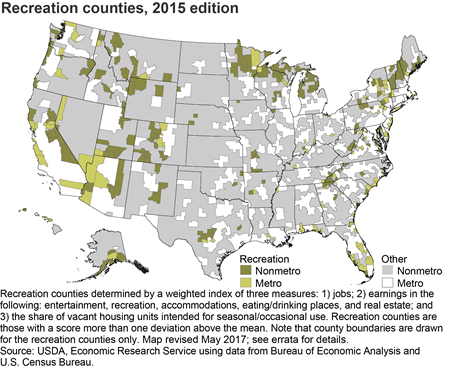
Recreation
Recreation (333 total, 229 nonmetro) counties were identified by calculating the percentage employed; the percentage of total earnings in entertainment, recreation, accommodations, eating and drinking places, and real estate; and the percentage of vacant housing units intended for seasonal of occasional use reported in the 2010 Census of Population. The three variables measuring employment, earnings, income, and seasonal housing were converted to a weighted index, and counties scoring at least two-thirds of a standard deviation above the mean were considered to be recreation counties. See the documentation for more details.
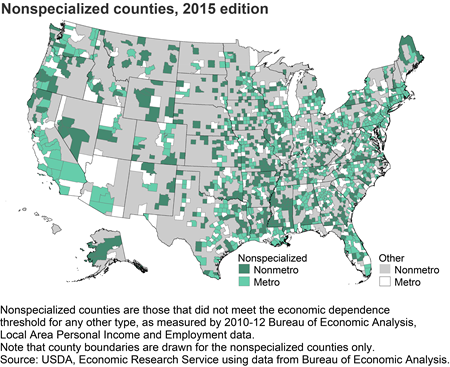
Nonspecialized
Nonspecialized (1,237 total, 585 nonmetro) counties did not meet the dependence criteria for any other economic type.
County Policy Types, 2015 Edition
The following types are not mutually exclusive. A county may be none, one, or more policy type.
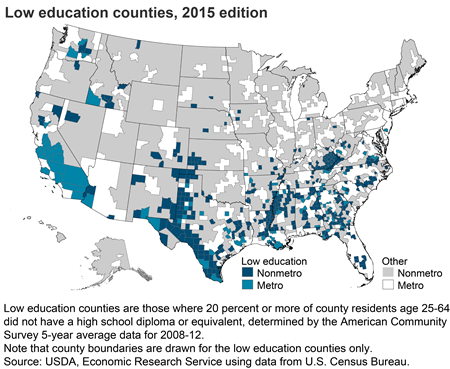
Low Education
Low-education (467 total, 367 nonmetro) counties: 20 percent or more of residents 25-64 years old had neither a high school diploma nor GED in 2008-12 (5-year average).
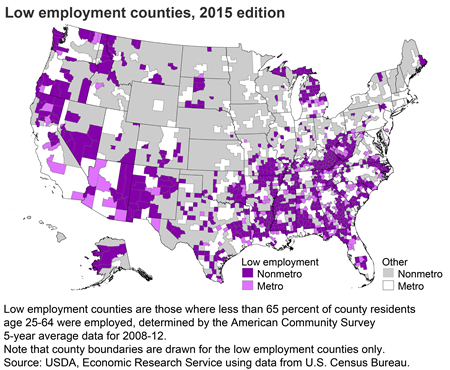
Low Employment
Low-employment (906 total, 720 nonmetro) counties: less than 65 percent of residents 25-64 years old were employed in 2008-12 (5-year average).
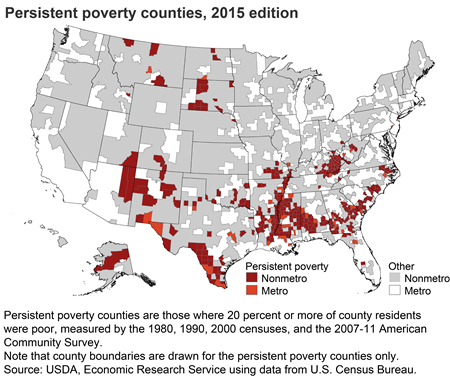
Persistent Poverty
Persistent poverty (353 total, 301 nonmetro) counties: 20 percent or more of residents were poor as measured by each of the 1980, 1990, 2000 censuses, and 2007-11 American Community Survey 5-year average. The persistent poverty counties were released in July 2014.
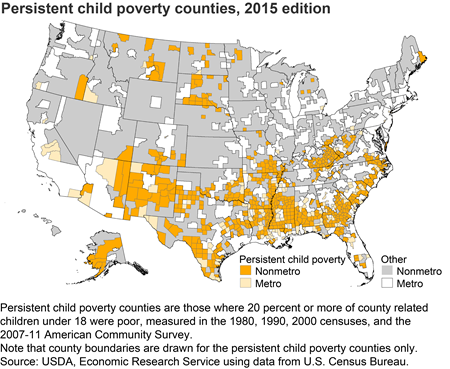
Persistent Child Poverty
Persistent child poverty counties (708 total, 558 nonmetro): 20 percent or more of related children under 18 years old were poor as measured by each of the 1980, 1990, 2000 censuses, and the 2007-11 American Community Survey 5-year average. The persistent child poverty Counties were released in May 2015.
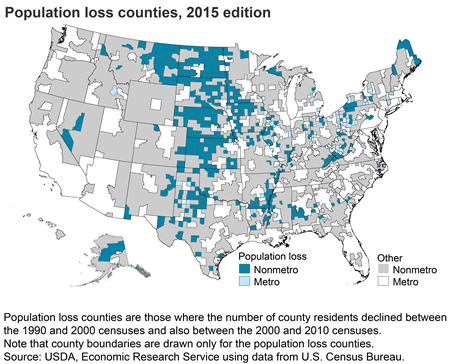
Population Loss
Population loss (529 total, 467 nonmetro) counties: number of residents declined both between the 1990 and 2000 censuses and between the 2000 and 2010 censuses.
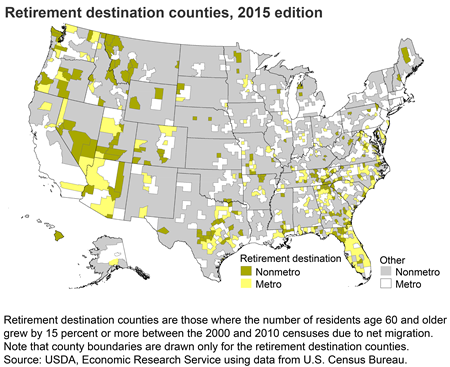
Retirement Destination
Retirement destination (442 total, 193 nonmetro) counties: number of residents 60 and older grew by 15 percent or more between 2000 and 2010 due to net migration.