

Documentation
USDA has estimated annual production costs and returns and published accounts for major field crop and livestock enterprises since 1975. Cost and return estimates are a primary data source reported for the United States and for Farm Resource Regions for corn, soybeans, wheat, cotton, grain sorghum, rice, peanuts, oats, barley, milk, hogs, and cow-calf.
The history of U.S. and regional cost and return estimates is divided into two categories:
- Recent: A time series of estimates made using the format and methods endorsed by the American Agricultural Economics Association task force on commodity costs and returns, as well as by using USDA Economic Research Service (ERS) Farm Resource Regions. The primary data sources used to develop these estimates are the Agricultural Resource Management Survey (ARMS) commodity versions and prices published by the USDA, National Agricultural Statistics Service (NASS).
- Historical: A time series of estimates from 1975 using the previous format, methods, and regional definitions.
Preliminary annual estimates are released during the first week of May and final annual estimates released during the first week of October. Data files for each commodity are in MS Excel format and as CSV files.
Cost-of-Production Forecasts are also available for U.S. major field crops. Cost-of-production forecasts are updated and released in mid-June and mid-November.
Costs and returns information provided in these data may be used as benchmark estimates for policy analysis, agricultural extension and research efforts, agricultural consulting, and agricultural business planning.
Scope/Coverage of Data
Commodity costs and returns data are provided for nine major U.S. field crops since 1975, for dairy since 1980, and for cow-calf and hogs since 1982. Commodity costs and returns information are also provided for earlier years for sugar beets (1981–2007) and tobacco (1996–2004). Commodity costs and returns information are provided at the national and regional levels for major production regions. New estimates are provided twice annually, during the first week of May and the first week of October.
Commodity cost and return records are "historical" accounts based on the actual costs incurred by producers. In this way, the records differ from "projected" accounts, often referred to as “enterprise budgets,” reported by most land grant universities to assist in farm planning. The costs and returns of all participants in the production process—including farm operators, landlords, contractors, and contractees—are included in the account. For this reason, the accounts are often referred to as "sector accounts," representing the costs and returns of all resources used in the production sector of each commodity.
Methods
Annual commodity costs and returns estimates are based on ARMS producer surveys conducted about every 4 to 10 years for each commodity and updated each year with estimates of annual price, acreage, and production changes. This ties the technology underlying the accounts to that used in the survey year. The most recent cost and return estimates for each commodity are based on surveys conducted in:
- 2021 for milk, corn, and rice
- 2020 for hogs
- 2019 for grain sorghum, barley, and cotton
- 2018 for soybeans and cow-calf
- 2017 for wheat
- 2015 for oats
- 2013 for peanuts
Estimates made in the survey year should be regarded as the most reliable because the estimates reflect both prices and technologies used on the commodity. The reliability of estimates in non-survey years likely varies for each commodity by the degree of technical and structural change that has occurred since the last survey. Commodity-specific surveys, as part of the annual ARMS, have been used to collect the data since 1996. Data in prior years were collected as part of the annual Farm Costs and Returns Survey (FCRS).
The theoretical basis and accounting methods used for the most recent estimates of commodity costs and returns conform with standards recommended by the American Agricultural Economics Association (AAEA) Task Force on Commodity Costs and Returns. In addition, accounts published in this format are presented using ERS Farm Resource Regions, which provide consistent regional delineation across the commodities.
The accounts include only costs incurred in the production of each crop commodity, excluding costs for marketing and storage. Returns above operating and total costs are computed by valuing production at the end of the production period, using a harvest-period price. However, producers often delay sales and store commodities with the expectation that the price—in later months—will exceed the harvest-period price plus the costs associated with carrying the crop inventory. This delay means the return estimates above operating and total costs likely understate those actually received by producers. Marketing costs and returns are included in the livestock accounts where production is typically not stored for a significant period before being marketed. The estimated returns for the crop commodities also exclude marketing loan benefits, which have been substantial for several commodities during years of low crop prices.
Data Sources
Data used to establish the cost and return estimates are based on producer surveys conducted about every 4–10 years for each commodity and updated each year with estimates of annual price, acreage, and production changes. Commodity-specific surveys as part of the annual ARMS have been used to collect the data since 1996. There are multiple versions of the ARMS each year, including whole-farm and commodity production practice and cost versions. Each production practice and cost version gathers detailed information about input use, field operations, and production costs of a particular commodity. Field enumerators personally interview farmers using questionnaires developed by the NASS and ERS. The ARMS data collection starts during the fall when production practice and cost data are collected. Data collection finishes in the spring when a follow-up interview collects data about whole-farm costs like overhead, interest, and taxes.
Each farm sampled in the ARMS represents a known number of farms with similar attributes so weighting the data for each farm by the number of farms it represents provides a basis for calculating target population estimates. Target populations for the crop commodities include all farms producing one or more acre of the commodity. To qualify for the ARMS hog survey, operations had to have a minimum of 25 head during the survey year. A minimum of 10 cows milked were required for dairy operations, while cow-calf operations needed to have 20 beef cows to qualify.
The survey data used in estimates for years prior to the ARMS were collected as part of the annual Farm Costs and Returns Survey (FCRS) from 1984 to 1995 and the Costs of Production Survey (COPS) prior to 1984. The types of data currently collected in the ARMS are essentially the same as the data that were collected through FCRS and COPS, except that FCRS and COPS surveys collected cost-of-production data and whole-farm financial data in one interview. Survey base years for estimates in the cost and return series are:
| Corn | 1978 | 1982–83 | 1987 | 1991 | 1996 | 2001 | 2005 | 2010 | 2016 | 2021 |
|---|---|---|---|---|---|---|---|---|---|---|
| Soybeans | 1978 | 1982–83 | 1986 | 1990 | 1997 | 2002 | 2006 | 2012 | 2018 | |
| Wheat | 1978 | 1982–83 | 1986 | 1989 | 1994 | 1998 | 2004 | 2009 | 2017 | |
| Cotton | 1978 | 1982 | 1987 | 1991 | 1997 | 2003 | 2007 | 2015 | 2019 | |
| Rice | 1979 | 1988 | 1992 | 2000 | 2006 | 2013 | 2021 | |||
| Sorghum | 1978 | 1982–83 | 1986 | 1990 | 1995 | 2003 | 2011 | 2019 | ||
| Barley | 1978 | 1982–83 | 1987 | 1992 | 2003 | 2011 | 2019 | |||
| Oats | 1978 | 1983 | 1988 | 1994 | 2005 | 2015 | ||||
| Sugarbeets* | 1980 | 1984 | 1988 | 1992 | 2000 | |||||
| Peanuts | 1977 | 1982 | 1987 | 1991 | 1995 | 2004 | 2013 | |||
| Flue-cured tobacco** | 1979 | 1987 | 1991 | 1996 | ||||||
| Burley tobacco** | 1984 | 1989 | 1995 | |||||||
| Dairy | 1979 | 1985 | 1989 | 1993 | 2000 | 2005 | 2010 | 2016 | 2021 | |
| Hogs | 1980 | 1985 | 1988 | 1992 | 1998 | 2004 | 2009 | 2015 | 2020 | |
| Cow-calf | 1980 | 1985 | 1990 | 1996 | 2008 | 2018 | ||||
| *Sugarbeet estimates were discontinued after 2007. **Flue-cured and burley tobacco estimates were discontinued after 2004. |
||||||||||
Estimates made prior to the first year listed were based on various surveys conducted through 1974–76. The 1982–83 survey was for all major crops, which were split into Southern States (1982) and Northern States (1983).
Since cost-of-production data for each commodity are only collected about every 4 to 10 years, estimates for non-survey years use the actual survey year as a base and use price indices and other indicators to reflect year-over-year changes. This can cause discontinuities when new survey data replace these non-survey estimates. The magnitude of these discontinuities has depended on how much technical and/or structural change occurred in the sector between the survey years, as well as changes in the sampling, questionnaire, and other data collection procedures. The survey data are supplemented with price and production data from other sources—mainly NASS Agricultural Prices and Crop Production publications to develop the annual estimates during non-survey years.
Structure of the Accounts
Commodity costs and returns include estimates of both cash expenditures and noncash costs. Cash expenditures are incurred when factors of production are purchased or rented. Noncash costs occur when factors are owned. For example, if a farmer fully owns the land used to produce corn, the farmer would have no expenditure for land rental or for loans to pay for the purchase of land. Yet, an economic cost arises. By owning the land and using it to grow corn, the farmer foregoes income from other uses of the land, such as renting it to another producer. These costs come about because production resources are limited and have alternative uses. If a farmer uses savings to pay for operating inputs (such as seed, fertilizer, chemicals, and fuel) and thus pays no interest on operating loans, the farmer still incurs an economic cost because the savings could have earned a return in another use. Likewise, the farmer has an opportunity cost of their labor used in commodity production because the cost could have been used on another farm or in off-farm employment.
The cost and return accounts were categorized into cash and economic costs for all commodities from 1975 to 1994. Beginning in 1995, the accounts were revised to conform with methods recommended by the American Agricultural Economics Association Task Force on Commodity Costs and Returns. The Task force recommended the cost and return account be divided into operating costs and allocated overhead costs. When a commodity was subsequently surveyed after 1995, this format has been used in the accounts. Below is a table of comparison between methods.
| Component | Former USDA method | Implementation of AAEA recommendation* |
|---|---|---|
| Seed | Survey direct cost for purchased seed, seed technology fees, and costs of seed cleaning, and opportunity cost of homegrown seed | Same as USDA method |
| Fertilizer and soil conditioners | Survey direct cost | Survey direct cost for fertilizers. Soil-conditioner cost spread over years of useful life |
| Manure | Not included | Estimated nutrient value (nitrogen, phosphorus and potassium) of the quantity of manure applied to the crop |
| Chemicals | Survey direct cost | Same as USDA method |
| Custom | Survey direct costs for custom fertilizer and chemical application, soil tests, scouting, land preparation, cultivation, seeding, harvesting, and hauling | Same as USDA method |
| Fuel, lubrication, electricity | Engineering formula used to determine fuel use by type of machine, valued by State fuel price | Same as USDA method |
| Replacement | Estimate of annual capital requirement necessary to replace machinery over its assumed ownership period | Not included—see capital recovery |
| Nonland capital | Opportunity cost of the average amount of capital invested in machinery used on crop | Not included—see capital recovery |
| Repairs | Engineering formula used to determine annual repair cost based on machine, use, and State machine price | Similar to USDA method but amortizes the annual repair cost over the assumed machine ownership period |
| Capital recovery | Not included | Similar to USDA capital replacement and nonland capital but includes an interest charge on unrecovered capital |
| Paid and unpaid labor | Paid = direct cost for paid and contract labor plus other benefits. Unpaid = unpaid labor hours times State wage rate for agricultural workers | Paid = same as USDA method. Unpaid = unpaid labor hours times estimated opportunity wage rate of farm operators working off-farm |
| Land rent | Composite of cash rent and an estimated share rental value based on landlord returns and costs | Cash rental rates using State rent-to-value estimates to impute a cash rental rate on share rented and owned land |
| Operating capital | Opportunity cost of the investment in total variable cash costs during the growing season | Opportunity cost of the investment in total operating costs during the growing season |
| General farm overhead | Farm cost of utilities, supplies, maintenance of general use structures, and general business expense allocated by relative value of production | Same farm costs as in USDA method allocated by relative gross margins |
| Taxes and insurance | Real estate tax, non-real estate property tax, property/casualty/liability insurance allocated by relative value of production | Non-real estate property tax and property/casualty/ liability insurance allocated by relative gross margins |
| Reporting format | ||
| Former USDA method | Implementation of AAEA recommendation* | |
| Farm cost of utilities, supplies, maintenance of general use structures, and general business expense allocated by relative value of production | Same farm costs as in USDA method allocated by relative gross margins | |
| Variable costs: seed, fertilizer, chemicals, custom, fuel, repairs, ginning, paid labor, purchased water | Operating costs: seed, fertilizer, chemicals, custom, fuel, repairs, purchased water, interest on operating inputs, ginning | |
| Fixed costs: general farm overhead, taxes and insurance, interest | Allocated overhead: paid and unpaid labor, capital recovery, land, taxes and insurance, general farm overhead. | |
| Economic costs: variable costs, general farm overhead, taxes and insurance, capital replacement, operating and nonland capital, land, unpaid labor | Returns: above cash expenses, residual returns to management and risk | |
| Returns: above operating costs, above total costs listed | ||
| *AAEA = American Agricultural Economics Association. Source: USDA, Economic Research Service. |
||
Regions
Beginning in 1995, the cost and return accounts have been reported using ERS Farm Resource Regions. This regional definition provides a consistent delineation across all the commodities and attempts to classify farms into homogeneous resource and farm-type regions. Commodity accounts are reported only in the regions where enough survey observations are available to make a statistically reliable estimate. Some modifications are made to the regional delineation for situations where the production practices in different areas of a region differ to the extent that separate regions are warranted. A spreadsheet that can be used to link county to Farm Resource Region can be found here.
Prior to 1995, State boundaries were used to delineate regions for most commodities. States were grouped according to those with similar production practice and resource characteristics. Historical cost and return accounts for commodities reported under the old format use these regional definitions.
Estimating Costs and Returns
Methods recommended by the American Agricultural Economics Association Task Force on Commodity Costs and Returns have been used to estimate the costs and returns of commodities surveyed in 1995 or later. Specifics of the recommendations can be found in the published Commodity Costs and Return Estimation Handbook. The following is an overview of the estimation methods. The gross value of crop production is calculated by valuing the survey crop yields by State-average harvest-month crop prices in each year.
The gross value of livestock production is the cash receipts received from the sales of feeder animals, market animals, and milk. The value of secondary products such as wheat and oat straw, cottonseed, cull animals, and manure, are also included for both crop and livestock commodities. Secondary products are also valued using survey production levels and State-average prices, or actual cash receipts for some products.
Four basic approaches are used to estimate the commodity costs: direct costing, valuing input quantities, indirect costing, and allocating whole-farm expenses. The choice among approaches used to estimate cost items is mainly driven by the ability of farmers to report commodity specific costs for that item in question. For example, most farmers can report the cost of seed purchased for a commodity but cannot report the fuel cost for a commodity because fuel is typically used to produce several commodities on the same farm.
| Direct costing | Valuing input quantities | Indirect costing | Allocating whole-farm expenses |
|---|---|---|---|
| Crop commodities | |||
| Purchased seed | Homegrown seed | Fuel, lube, and electric | General farm overhead |
| Fertilizer | Manure | Repairs | Taxes and insurance |
| Chemicals | Unpaid labor | Capital recovery | |
| Custom operations | Land | ||
| Hired labor | Operating interest | ||
| Purchased water | Ginning | ||
| Livestock commodities | |||
| Purchased feed | Homegrown feed | Capital recovery | General farm overhead |
| Feeder animals | Grazed feed | Taxes and insurance | |
| Veterinary and medicine | Unpaid labor | ||
| Bedding and litter | Land | ||
| Marketing | Operating interest | ||
| Custom services | |||
| Fuel, lube, and electric | |||
| Repairs | |||
| Source: USDA, Economic Research Service. | |||
Direct costing involves summarizing survey responses to questions about the amounts paid for each input item. For items such as crop fertilizer and chemicals, direct costing is accomplished by asking the farmer how much was paid—per acre—for the inputs used to produce the crop. For other items such as livestock custom services and repairs, direct costing is accomplished by asking the farmer how much of the total farm expenditures for each input were for production of the livestock commodity. Direct costing is the preferred cost estimation procedure because it does not require any assumptions about prices or quantities. However, direct costing only works well when the farmer has commodity-specific records or can recall the amount spent for the commodity.
Valuing input quantities combines survey data on the physical quantities used in the production process with secondary data on input prices. This approach is particularly useful in situations where farm-produced or farmer-owned inputs are used and opportunity costs are the best means of determining the input values. For example, the costs of homegrown seed and homegrown feed are estimated by valuing the quantities of each used by crop prices. An estimate of the manure nutrient content is valued using State nutrient prices. Unpaid labor hours are valued using an estimate of the wages earned off-farm by farm operators. Land is valued according to the average cash rental rate for land producing the commodity in the particular area. Operating interest is an estimate of the opportunity cost of the investment in the operating inputs during the production period using the 6-month Treasury Bill interest rate.
Indirect costing uses a combination of survey information on production practices, technical information on machine performance, and engineering formulas determined from machinery tests. This method is particularly useful for estimating the costs associated with using farm machinery and equipment because these items are typically used to produce multiple farm commodities and thus are not easily allocated to a single commodity. The method combines survey information on machine type, size, and hours used with secondary information on fuel use rates, repair rates, replacement costs, and years of expected life to drive engineering formulas that compute annual machinery operating and ownership costs. These costs are computed for tractors, trucks, field machinery, and the irrigation and drying equipment used in crop production, as well as the housing, feed storage, and manure-handling equipment used in livestock production. The capital recovery method for estimating asset ownership costs replaced the previous capital replacement and nonland capital estimates, per the Task Force recommendations. National machinery replacement prices are used in the capital recovery and repair cost estimates, while State fuel prices are used to estimate the cost of fuels used. An estimate of the long-run rate of return to farm assets out of current income (10-year moving average) is used as the interest rate in the capital recovery estimate.
Allocating whole-farm expenses takes survey responses to whole-farm expense items and allocates them to a commodity according to some allocation scheme. This method is particularly useful for estimating items whose cost cannot be directly attributable to a single commodity, but where all commodities must pay the cost. The allocation scheme used in the cost and return accounts is an estimate of the share of total farm operating margin—value of production minus operating costs—accounted for by the commodity. For example, if a commodity accounts for 30 percent of the total farm operating margin, the commodity is charged 30 percent of the overhead, taxes, and insurance costs. General farm overhead costs include costs for farm supplies, marketing containers, hand tools, power equipment, maintenance and repair of farm buildings, farm utilities, and general business expenses. Taxes include non-real estate property taxes and insurance is farm property insurance, excluding crop insurance.
Glossary of Terms
Often, we are asked questions about the meaning of the terms and concepts ERS uses in describing farm production costs and returns. This glossary is intended to provide users with working definitions of key terms and a better understanding of how these concepts are applied in estimating the performance of the farm production sector.
- Allocated overhead
- Capital recovery
- Capital replacement
- Cash costs
- Economic costs
- General farm overhead
- Harvest-month price
- Land costs
- Nonland capital
- Operating capital
- Operating costs
- Residual returns to management and risk
- Taxes and insurance
- Unpaid labor
- Variable costs
Allocated overhead: Allocated overhead is a category of expenses recommended by the American Agricultural Economics Association (AAEA) taskforce and is similar to economic costs under the former methods. These expenses include costs of hired labor, opportunity cost of unpaid labor, capital recovery of machinery and equipment, opportunity costs of land, general farm overhead, and taxes and insurance.
Capital recovery: After switching to the AAEA task force recommendations, the capital recovery method for estimating asset ownership costs replaced the previous capital replacement and nonland capital estimates. Capital recovery cost is an estimate of the cost of replacing the capital investment in machinery and equipment that is used up in the annual production process, plus interest that the remaining capital could have earned in an alternative use. Capital recovery is estimated based on replacement prices paid for farm machinery each year. An estimate of the long-run rate of return to farm assets out of current income (10-year moving average) is used as the interest rate in the capital recovery estimate. The long-term realized rate of return to these specialized resources is used to reflect that these resources can be used effectively only in the agricultural sector. The major advantage of capital recovery over capital replacement and nonland capital estimates is that it more accurately measures the actual capital costs incurred in the production process.
Capital replacement: Capital replacement (or economic depreciation) is the portion of the value of machinery and equipment, in addition to repairs, that is used up in the production of a particular commodity. Capital replacement is based on the current value of the machinery. Capital replacement may be regarded as a discretionary expense in any particular year. It may be deferred when income is low but ultimately must be paid to maintain the capital stock so that over the long term, the operation remains in business.
Cash costs – Cash costs are the out-of-pocket expenses paid in cash. These costs include variable and fixed inputs such as seed, fertilizer, feed, overhead, and cash interest payments. Cash costs depend on production practices and on quantities and prices of inputs. The fixed cash expenses, which are difficult to attribute directly to a specific enterprise on a farm, are allocated to each crop or livestock enterprise based on the commodity's relative value of production.
Economic costs: Economic costs are the full ownership costs—both cash and noncash—for operating the business. Costs account for all production inputs, without regard to the ownership or equity positions of farm operators. They include both variable and fixed cash expenses (except interest payments); capital replacement; and imputed costs of land, unpaid labor, and capital invested in production inputs and machinery.
General farm overhead: General farm overhead costs are the expenses for items such as farm supplies, marketing containers, hand tools, power equipment, maintenance and repair of farm buildings, farm utilities, and general business expenses that cannot be directly attributed to a single farm enterprise. In the old accounting methods, costs of general farm overhead items were allocated to each commodity based on its value of production relative to that of other farm commodities. After switching to the AAEA task force recommendations, costs of general farm overhead items were allocated to each commodity based on its relative contribution to total farm operating margin (i.e. the value of production minus operating costs).
Harvest-month price: Harvest-month price is used to value the production for crops since the cost-of-production accounts do not include marketing costs. To use a marketing-year average price would necessitate measuring the costs associated with storage as well as other marketing-related expenses.
Land costs: Land is a specialized input. Its value as a production input depends on the value of the crops or livestock it produces, which is reflected in rental costs. Because an alternative use for land for any landowner is to rent it to someone who will produce the same commodity, ERS values land in cost-of-production accounts at its rental value. In the old accounting methods, the land rental rates for each crop were composites of share and cash rental rates. The estimated “net” land rent was the gross rent minus real estate taxes and the value of any inputs supplied by landlords. After switching to the AAEA task force recommendations, cash rental rates on land producing the commodity were used to estimate the land cost. In areas where cash rental markets were thin, share rent equivalents were used to estimate land costs.
Nonland capital: Returns to nonland capital is the opportunity cost of having capital invested in farm machinery and equipment. ERS calculates this cost using an estimate of machinery and equipment values times the sector-wide, long-run rate of return to production assets from current income. The long-term realized rate of return to these specialized resources is used to reflect that these resources can be used effectively only in the agricultural sector.
Operating capital: Returns to operating capital is the opportunity cost of carrying input expenses from the time they are used until harvest—for crops—or throughout the year—for livestock. ERS measures the return to operating capital at the annual average rate of 6-month U.S. Treasury bills. This rate is used as a proxy for the next best risk-free alternative use of capital.
Operating costs: Operating costs are a category of costs similar to variable costs under the former accounting methods. These costs include inputs such as seed, fertilizer, feed, chemicals, and interest on operating capital. However, hired labor is not included under operating costs but is considered as allocated overhead.
Residual returns to management and risk: Residual returns to management and risk is the difference between the gross value of production and total economic costs. The return to management and risk indicates the extent to which long-run production costs are covered by production valued at average harvest-month prices.
Taxes and insurance: Taxes and insurance are overhead costs that are not directly attributable to a farm enterprise but must be paid by all enterprises. In the old accounting methods, real estate tax cost per acre was charged on the acres used to produce the commodity, whereas farm expenditures for other property taxes and insurance were allocated to the commodity based on its value of production relative to that of other farm commodities. Real estate taxes were included because real estate tax costs were netted out of the land cost. After switching to the AAEA task force recommendations, property taxes and insurance were allocated to each commodity based on its relative contribution to total farm operating margin (i.e. value of production minus operating costs). Real estate tax costs were excluded because they were not netted out of the land cost.
Unpaid labor: Unpaid labor includes the opportunity costs of providing unsalaried labor. Labor provided by the farm operator and labor services provided by partners and family members are examples of unpaid labor. Unpaid labor hours are measured directly in commodity surveys. In the old accounting methods, unpaid labor was valued annually at the hired wage rate for all agricultural employees. After switching to the AAEA task force recommendations, unpaid labor was valued at an estimate of the off-farm wages paid to farm operators working off-farm.
Variable costs: Variable costs are the out-of-pocket cash expenses paid for inputs unique to the commodity being produced. Variable expenses depend on production practices, input quantities, and input prices. These expenses include inputs such as seed, fertilizer, feed, chemicals, and hired labor.
Old Production Regions
Prior to 1995, State boundaries were used to delineate most commodity regions. States were grouped according to those with similar production practices and resource characteristics. Cost and return accounts for commodities reported under the old format still use these regional definitions.
Northeast: New York and Pennsylvania
Southeast: Georgia, Kentucky, Louisiana, and North Carolina
North Central: Illinois, Indiana, Iowa, Michigan, Minnesota, Missouri, Ohio and Wisconsin
Plains States: Colorado, Kansas, Nebraska, South Dakota, and Texas
Source: USDA, Economic Research Service.
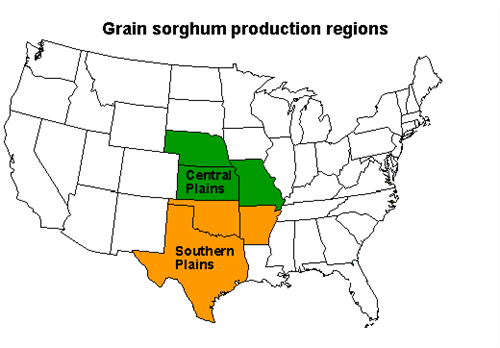
Central Plains: Kansas, Missouri, and Nebraska
Southern Plains: Arkansas, Oklahoma, and Texas
Source: USDA, Economic Research Service.
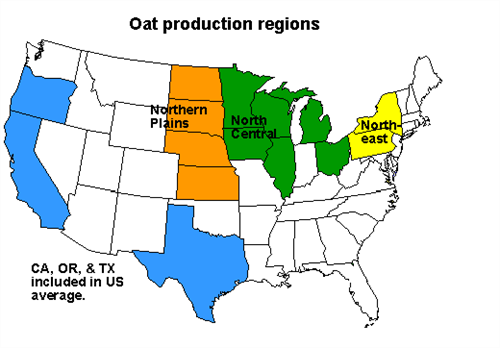
Northeast: New York and Pennsylvania
North Central: Illinois, Iowa, Michigan, Minnesota, Ohio, and Wisconsin
Northern Plains: Kansas, Nebraska, North Dakota, and South Dakota
Source: USDA, Economic Research Service.
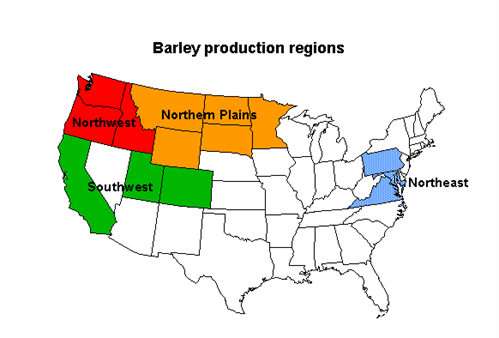
Northeast: Maryland, Pennsylvania, and Virginia
Northern Plains: Minnesota, Montana, North Dakota, South Dakota, and Wyoming
Northwest: Idaho, Oregon, and Washington
Southwest: California, Colorado, and Utah
Source: USDA, Economic Research Service.
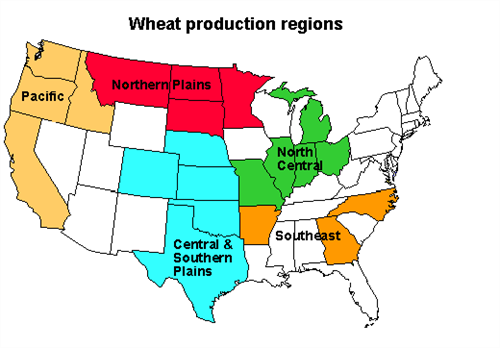
North Central: Illinois, Indiana, Missouri, Ohio, and Michigan
Southeast: Arkansas, Georgia, and North Carolina
Northern Plains: Minnesota, Montana, North Dakota, and South Dakota
Central and Southern Plains: Colorado, Kansas, Nebraska, Oklahoma, and Texas
Pacific: California, Idaho, Oregon, and Washington
Source: USDA, Economic Research Service.
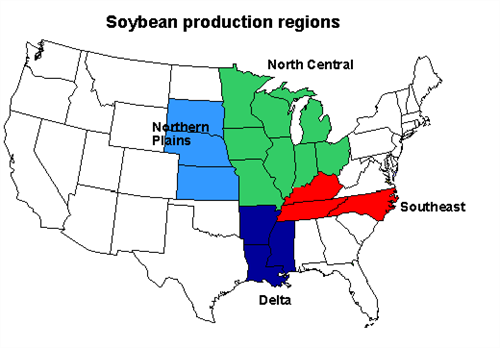
North Central: Illinois, Indiana, Iowa, Michigan, Minnesota, Missouri, Ohio, and Wisconsin
Northern Plains: Kansas, Nebraska, and South Dakota
Southeast: Kentucky, North Carolina, and Tennessee
Delta: Arkansas, Louisiana, and Mississippi
Source: USDA, Economic Research Service.
Arkansas (Non-Delta): Grand Prairie Counties
California: Sacramento Valley
Gulf Coast: Bayou Prairies of Louisiana and North Gulf Coast of Texas
Mississippi River Delta: River Counties of Arkansas, Louisiana, and Mississippi
Source: USDA, Economic Research Service.
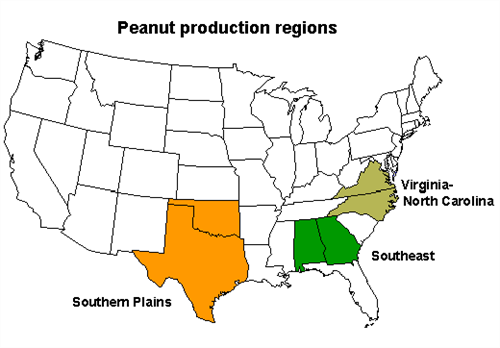
Virginia and North Carolina
Southeast: Alabama and Georgia
Southern Plains: Oklahoma and Texas
Source: USDA, Economic Research Service.
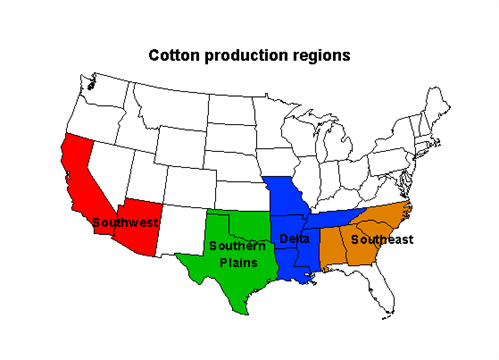
Southeast: Alabama, Georgia, North Carolina, and South Carolina
Delta: Missouri, Arkansas, Louisiana, Mississippi, and Tennessee
Southern Plains: Oklahoma and Texas
Southwest: Arizona and California
Source: USDA, Economic Research Service.
Flue-Cured: Georgia, North Carolina, South Carolina, and Virginia
Burley: Kentucky and Tennessee
Source: USDA, Economic Research Service.
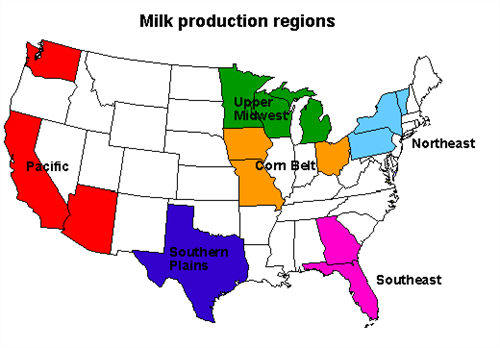
Northeast: New York, Pennsylvania, and Vermont
Southeast: Florida and Georgia
Upper Midwest: Michigan, Minnesota, and Wisconsin
Corn Belt: Iowa, Missouri, and Ohio
Southern Plains: Texas
Pacific: Arizona, California, and Washington
Source: USDA, Economic Research Service.
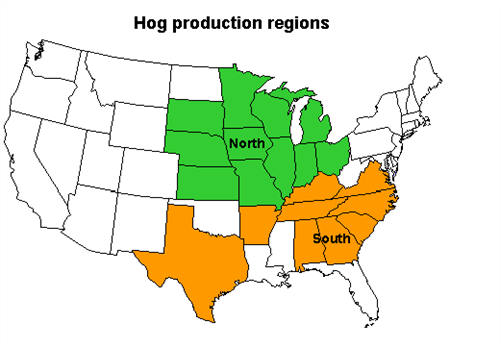
North: Illinois, Indiana, Iowa, Kansas, Michigan, Minnesota, Missouri, Nebraska, Ohio, South Dakota, and Wisconsin
South: Alabama, Arkansas, Georgia, Kentucky, North Carolina, South Carolina, Tennessee, Texas, and Virginia
Source: USDA, Economic Research Service.
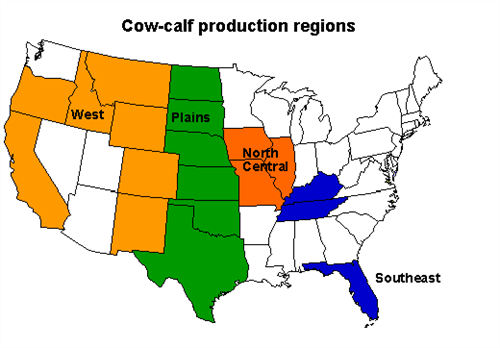
North Central: Illinois, Iowa, and Missouri
Southeast: Florida, Kentucky, and Tennessee
Plains: Kansas, Nebraska, North Dakota, Oklahoma, South Dakota, and Texas
West: California, Colorado, Idaho, Montana, New Mexico, Oregon, and Wyoming
Source: USDA, Economic Research Service.
Cost of Production Forecasts
Cost of production forecasts for crops are estimated and posted for each current year and each subsequent year twice annually, once in June and again in November. Cost of production forecast estimation assumes the most recent commodity survey year as the base production technology, with forecasts made on the basis of estimated prices for forecast years. An econometric forecasting model maintained by ERS is used as the basis for estimating input price forecasts. Further details on factors used to forecast cost of production estimates may be requested.
Strengths and Limitations
Commodity costs and returns estimates may be considered as average estimates for production of agricultural commodities at regional or national levels. Because production technology, input usage, and production efficiency can vary widely across farms—these estimates cannot be assumed to represent all farms or all production conditions. In cases where there is sufficient coverage of alternative production practices, additional analysis may be conducted to further delineate commodity costs and returns under alternative production scenarios.
Cost of production forecasts result from use of an ERS forecasting model and economist evaluation shortly prior to publication. These forecasts are limited to the factors that can be included in the model and evaluated by the economists. Users should note that many factors can impact input prices and input markets can change rather rapidly.
Resources
For selected ERS reports using the ERS Commodity Costs and Returns Data, please go to the Readings tab in the top left-hand corner of this page.
The AAEA Task Force Commodity Costs and Returns recommendations can be found here.
Agricultural Resource Management Survey questionnaires can be found here.
Recommended Citation
U.S. Department of Agriculture, Economic Research Service. Commodity Costs and Returns data.