

Who is Served by USDA Rural Broadband Projects? Study Shows Smaller Share of Eligible American Indians and Alaska Natives Reached by ReConnect

Highlights:
-
The U.S. Government has invested or committed more than $100 billion to bring high-speed internet broadband service to unserved and underserved areas. USDA, Economic Research Service studied who is served by three USDA-administered broadband programs: the Broadband Initiatives Program, Community Connect, and ReConnect.
-
The ReConnect program, established in 2018, is now USDA’s largest broadband program. Targeted to areas without broadband, it served 0.12 percent of the total U.S. population but 21 percent of the population in areas eligible for the program through grant and loan projects approved in the first two funding rounds.
-
ReConnect projects served a larger share of the total American Indian and Alaska Native (AIAN) population than other races because a larger share of the AIAN population was eligible for the program. However, AIAN residents had a smaller share of their eligible population in approved project areas than most other racial and ethnic groups because a smaller share of eligible AIANs lived in areas that had applied for funding.
-
The population of ReConnect-eligible areas tended to have less formal education and be poorer and older than the population of ineligible (better served) areas. However, more education and less poverty characterized populations in areas for which service providers had applied for ReConnect projects than in eligible areas without a program application.
Affordable and reliable high-speed broadband is increasingly necessary to participate in the modern economy and access Government services. Still, millions of people living in the United States, especially in rural and Tribal areas, lack access to sufficient broadband service. As recently as June 2023, more than 14 percent of households in rural areas and nearly 12 percent of those in Tribal areas lacked access to broadband, compared with 3 percent of households in metropolitan areas, according to data from the Federal Communications Commission (FCC). To address this digital divide, the U.S. Government has invested more than $50 billion in Federal broadband programs and, since 2020, has committed more than $85 billion in new broadband programs.
Despite the amount of money invested in Federal broadband programs, there is little published research on who is served by them.
To begin to answer this question, USDA, Economic Research Service (ERS) investigated what areas and populations were reached by three USDA rural broadband programs: the Broadband Initiatives Program, the Community Connect grant program, and the ReConnect grant and loan program.
The Broadband Initiatives Program (BIP) was a one-time grant and loan program established by the American Recovery and Reinvestment Act of 2009 with a $2.5 billion appropriation. Conducted in two rounds in fiscal years (FY) 2009 and 2010, it was the largest USDA broadband program (in terms of appropriations) before ReConnect. The ReConnect grant and loan program—established as a pilot program by the Consolidated Appropriations Act of 2018 and extended since then by annual appropriations acts and other legislation—received more than $5 billion in appropriations from FY 2018 through FY 2023 and is now USDA’s largest broadband program. Community Connect—established in 2002—is a much smaller grant program with annual appropriations ranging from $9 million to $35 million per year since its inception.
The ERS study found the three programs reached a larger share of people in rural census tracts than in urban areas, consistent with the programs’ rural focus. On average, the residents of service areas for approved projects had received less formal education and were poorer and older than populations in other areas of the country. Researchers also found a much larger share of the American Indian or Alaska Native (AIAN) population than other racial or ethnic groups lived in areas that were eligible for service through Community Connect and ReConnect programs (they were not able to estimate areas eligible for the Broadband Initiatives Program). For ReConnect, however, projects approved during the first two funding rounds (conducted in FY 2019 and FY 2020) served only 10 percent of the AIAN population living in eligible areas, the lowest proportion among racial or ethnic groups.
By law, ReConnect and Community Connect support broadband projects only in rural areas, as defined by program regulations. BIP supported projects in urban areas as well as rural, although at least 75 percent of the BIP-served areas were required to be rural. During the first two funding rounds of ReConnect, at least 90 percent of the households in a proposed service area had to be unserved by broadband. For BIP, the eligibility requirements were simplified and relaxed between the first and second rounds. In the second round, only 50 percent of the premises in a proposed service area were required to be unserved. For Community Connect grants, the entire proposed service area must be unserved by broadband.
Broadband Initiatives Program Was Largest of the Three USDA Programs During the Study Period (FY 2009–21)
Based on USDA, Rural Utilities Service (RUS) data, BIP was by far the largest of the three programs studied, not only in terms of appropriations during the FY 2009–21 period, but also in terms of the number of projects approved and financial obligations to fund those projects. In FY 2010, USDA approved 322 BIP projects, more than the 160 Community Connect projects approved during the entire study period or the 181 projects approved in the first two rounds of ReConnect funding from FY 2019–21. The total value of grant and loan obligations provided through completed BIP projects was nearly $3.6 billion (in inflation-adjusted 2020 dollars), compared with $1.5 billion in loans and grants provided by ReConnect (FY 2019–21) and $243 million in grants provided by Community Connect from FY 2009 to FY 2021.
BIP also was much larger than the other programs in terms of the population living in project service areas of the program. More than 4 million people lived in BIP service areas in 2010, compared with about 400,000 living in ReConnect project areas approved during the first 2 rounds of funding and about 40,000 living in Community Connect areas approved from FY 2018 to FY 2021.
The value of program obligations per person served in BIP project areas was much less than that for the other two programs: $875 for BIP compared with $3,369 for Community Connect and $3,777 for ReConnect (all values in 2020 dollars). Part of the reason for lower per-person obligations for BIP projects was that, unlike the other two programs, BIP was not limited to serving rural areas. As a result, the population density of BIP service areas was higher than that of Community Connect or ReConnect, resulting in lower per-person obligations. However, the inflation-adjusted obligations of BIP projects per square mile also were lower than those of the other two programs, so differences in population density are only part of the explanation.
Another likely reason for higher per-person financial obligations of more recent Community Connect and ReConnect projects is the advancement of broadband technologies and speed requirements of the programs. Broadband speeds are measured by how many bits of data per second can be downloaded from the internet to a computer and how many bits per second can be uploaded from a computer to the internet. Over time, the FCC has increased the minimum download and upload speeds for internet service to be considered “advanced telecommunications capability” (broadband), from at least 200 kilobits (Kbps) per second download and upload speeds before 2010 to a download speed of at least 25 megabits per second (Mbps) and upload speed of at least 3 Mbps in 2015, which remains the current FCC definition. The FCC considers these speeds sufficient to allow users to originate and receive high-quality voice, data, graphics, and video communications.
In the second (and larger) of the two rounds of BIP funding, projects were required to achieve combined download and upload speeds of 5 Mbps, but Community Connect projects since FY 2018 and ReConnect projects in FY 2019 and FY 2020 aimed to achieve a download speed of at least 25 Mbps and an upload speed of at least 3 Mbps. These higher speed requirements have led to greater emphasis on providing higher cost fiber optic service to households or businesses, known as fiber-to-the-premises technology. About two-thirds of BIP projects supported this fiber optic technology, but more than three-fourths of Community Connect projects and 97 percent of ReConnect projects supported it during the study period. Such differences in technologies may account in part for the lower obligations per square mile of BIP projects compared to the other two programs.
| Variable | Broadband Initiatives Program | ReConnect |
Community Connect |
|---|---|---|---|
| Fiscal years program provided funding | 2010–15 | 2019–present | 2002–present |
| Fiscal years considered | 2010 | 2019–21 | 2018–21 |
| Financial obligations (inflation-adjusted 2020 dollars) | $3.565 billion | $1.502 billion | $143 million |
| Population of project service areas | 4.075 million | 398,000 | 42,500 |
| Obligations per person in project service areas (inflation-adjusted 2020 dollars) | $875 | $3,777 | $3,369 |
| Population density of project service areas | 30.23 persons per square mile | 13.40 persons per square mile | 24.53 persons per square mile |
| Obligations per square mile in project service areas (inflation-adjusted 2020 dollars) | $26,451 | $50,625 | $86,642 |
| Note: Estimates of population and population density for the Broadband Initiatives Program (BIP) are based on 2010 U.S. Population Census data from the U.S. Department of Commerce, Bureau of the Census. Estimates of population and population density for the Community Connect and ReConnect programs are based on 2020 U.S. Population Census data. Financial obligations include the value of grants and loans approved during the period considered, excluding rescinded projects. Obligations are adjusted for inflation to 2020 dollars using the U.S. Department of Labor’s Consumer Price Index for all urban consumers. Source: USDA, Economic Research Service analysis of data from USDA, Rural Utilities Service and U.S. Population Census data from the U.S. Department of Commerce, Bureau of the Census. |
|||
ReConnect Reached One-Fifth of Eligible Population in Fiscal Years 2019–21
ReConnect and Community Connect project service areas are required to be outside of cities and towns with more than 20,000 people and outside of urban areas contiguous and adjacent to a city or town with more than 50,000 people. To be eligible for Community Connect, the entire proposal area also must be unserved by fixed terrestrial (land-based) broadband (mobile and satellite service were not considered). In its first funding round, ReConnect had the same requirement for grant-only projects, but grant/loan and loan-only projects required that at least 90 percent of households in proposed service areas lacked access. In the second round, all ReConnect projects carried the 90-percent requirement. Both Community Connect and ReConnect restricted eligibility in areas already served by other broadband programs, with more complex restrictions for ReConnect.
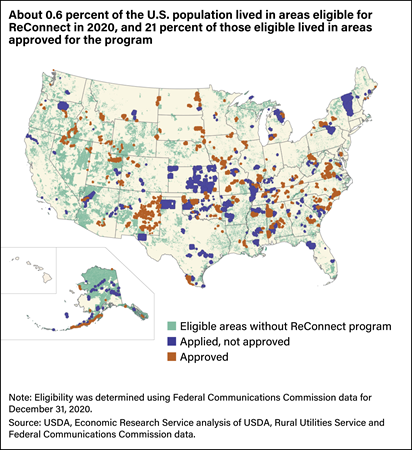
By mapping ReConnect and Community Connect program-eligible areas, ERS researchers found that about 0.6 percent of the U.S. population lived in places eligible for either program in 2020. Of this eligible population, 21 percent lived in ReConnect-approved areas, and 2.2 percent lived in Community Connect project areas approved from FY 2018 to 2021.
The researchers based their mapping on program eligibility requirements, as well as on RUS data on eligible rural areas and areas served by other programs and on FCC data on broadband availability. They combined the estimates of eligible areas with maps of approved project service areas for both programs and with 2020 U.S. Population Census data from the U.S. Department of Commerce, Bureau of the Census. From there, they were able to estimate the total population and population by race and ethnicity in eligible areas served or unserved by these programs. They also used RUS maps of areas proposed for ReConnect service but not approved to estimate the populations in these areas.
Larger Share of American Indian/Alaska Native (AIAN) Population Than Other Races Was Eligible for ReConnect
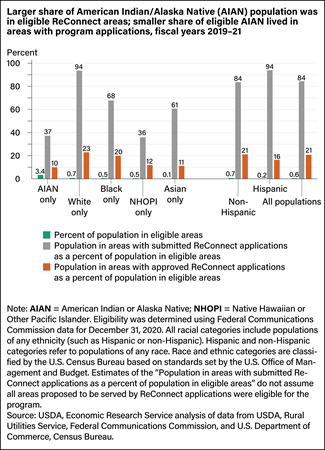
In 2020, 3.4 percent of the AIAN population lived in rural areas unserved by broadband and therefore eligible for ReConnect service projects. That is a larger share than for Whites (0.7 percent), Blacks/African Americans (0.5 percent), Native Hawaiians or Other Pacific Islanders (0.5 percent), and Asians (0.1 percent). For Hispanic populations, 0.2 percent lived in ReConnect-eligible areas, a smaller share than non-Hispanics (0.7 percent) and a reflection of the smaller share of Hispanics than non-Hispanics living in rural areas.
Smaller Share of Eligible AIAN Population Than Other Races Lived in Areas of Approved ReConnect Projects
However, within areas eligible for ReConnect projects, the share of the AIAN population in areas with approved projects, at 10 percent, was smaller than for other races and ethnicities. That compares with 23 percent of Whites, 20 percent of Blacks/African Americans, 12 percent of Native Hawaiians/Other Pacific Islanders (NHOPI), and 11 percent of Asians in eligible areas. The study showed 16 percent of Hispanics in eligible areas lived in approved ReConnect project service areas, compared with 21 percent of eligible non-Hispanics.
Researchers also distinguished between areas for which projects had been approved and those for which applications had been made but not approved. They found that only 37 percent of the eligible AIAN population and 36 percent of the eligible NHOPI population lived in areas that had ReConnect applications. That compares with 94 percent of eligible White residents, 68 percent of eligible Blacks/African Americans, and 61 percent of eligible Asians living in proposed project service areas. However, as a percent of the population living in areas where applications were submitted, the population of AIANs, NHOPIs, and Blacks in approved project areas was greater than for other races. This indicates the relatively low shares of the eligible AIAN and NHOPI populations who were served by ReConnect was due to a low level of project applications in the areas in which they lived, rather than to a low share of projects approved in areas with project applications.
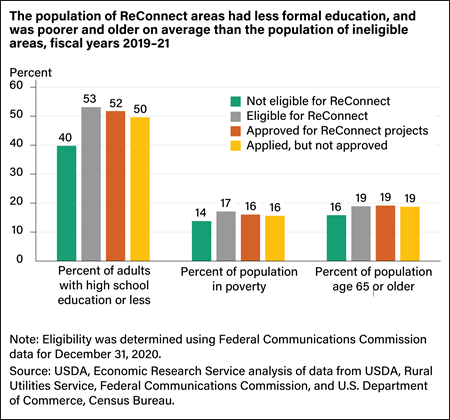
People in ReConnect Areas Were Less Educated, Poorer, and Older on Average Than Those in Ineligible Areas
The population of areas eligible for ReConnect and of areas applying for project funds (whether the application was approved or not) were more likely to have a high school education or less, have income below the Federal poverty line, and be aged 65 or older, than the population of areas ineligible for Reconnect. Smaller differences in these characteristics are evident among people living in eligible areas or areas for which there were program applications. People in areas in which internet providers have applied for ReConnect projects tend to have more formal education and be less poor than those in eligible areas without an application, suggesting a connection between education and poverty levels and the ability or interest of some eligible communities to apply for ReConnect.
Three USDA Rural Broadband Programs: Areas and Populations Served, by John Pender, Joshua Goldstein, Devika Mahoney-Nair, and Hanna Charankevich, ERS, October 2023
Rural America at a Glance: 2022 Edition, by James C. Davis, Anil Rupasingha, John Cromartie, and Austin Sanders, ERS, November 2022
First two rounds of USDA ReConnect broadband projects served a smaller share of eligible American Indians and Alaska Natives, Charts of Note, U.S. Department of Agriculture, Economic Research Service, October 17, 2023