

U.S. Farm Employers Respond to Labor Market Changes With Higher Wages, Use of Visa Program, and More Women Workers
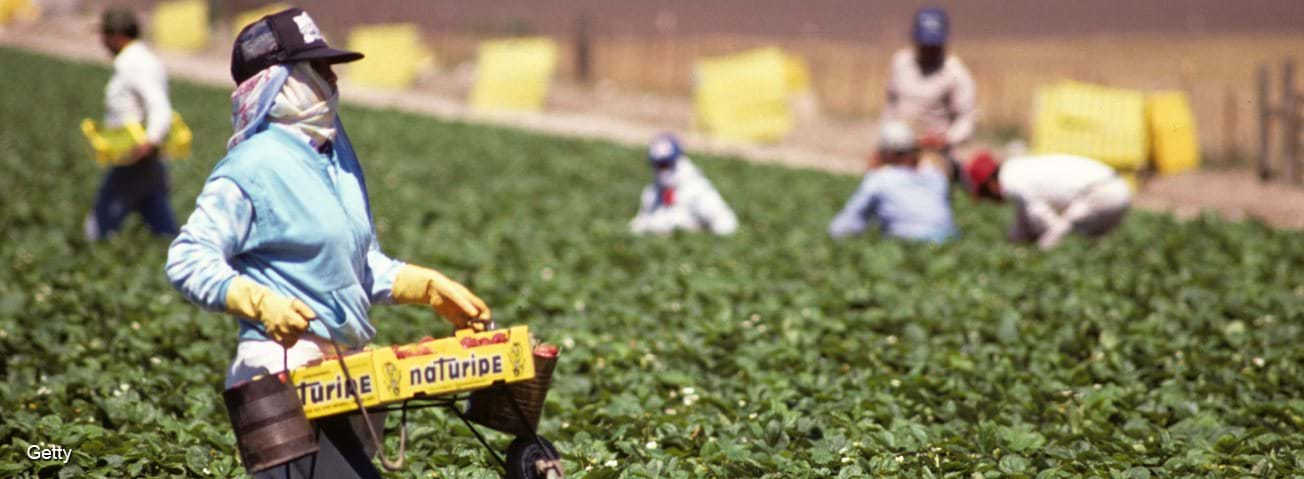
Hired farmworkers make up less than 1 percent of all U.S. wage and salary workers, but they play an essential role in labor-intensive industries within U.S. agriculture, such as the production of fruits, vegetables, melons, dairy, and nursery and greenhouse crops. Hired farmworkers are found in a variety of occupations, including field crop workers, nursery workers, livestock workers, graders and sorters, agricultural inspectors, supervisors, and hired farm managers. The majority are wage and salary workers, hired directly by farmers, but some are employees of agricultural service companies, such as farm labor contractors.
In 2016, 75 percent of hired farmworkers were foreign-born people, mostly from Mexico and Central America; about 60 percent of these immigrant farmworkers were not authorized to work legally in the United States, according to the U.S. Department of Labor’s National Agricultural Workers Survey. In recent years, the supply of farmworkers from Mexico available to work in U.S. agriculture appears to be declining. The labor market has responded to this shift in a longstanding source of workers in part through rising farm wages, increased use of the H-2A guest worker program, and an increase in the share of women in the farm workforce.
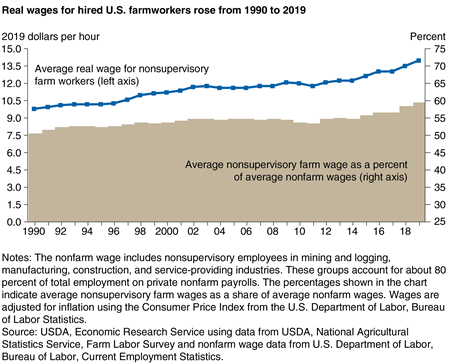
Farm wages have risen over time for nonsupervisory crop and livestock workers, excluding contract labor. According to data from the USDA’s Farm Labor Survey, real (inflation-adjusted) wages rose at an average annual rate of 1.1 percent between 1990 and 2019. In the past 5 years, real farm wages grew even faster at 2.8 percent per year. This is consistent with growers’ reports that the longstanding supply of workers from Mexico has decreased, as growers may respond over time by raising wages to attract workers from other sources.
The gap between farm and nonfarm wages has slowly shrunk but is still substantial. In 1990, the average wage for nonsupervisory farmworkers—$9.80 an hour in 2019 dollars—was about half the $19.40 wage of private-sector nonsupervisory workers in the nonfarm economy. By 2019, the $13.99 farm wage was 60 percent of the $23.51 nonfarm wage (see figure below).
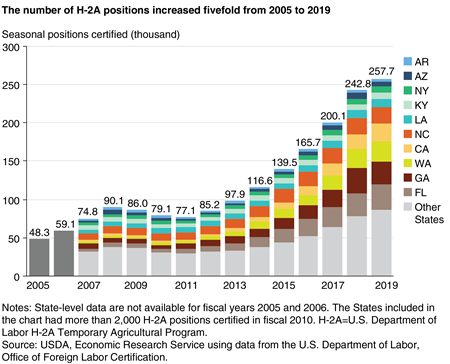
The H-2A Temporary Agricultural Program provides a legal means to bring foreign-born workers into the United States temporarily. Workers employed on an H-2A visa can stay in the United States for up to 10 months at a time. Employers must demonstrate, and the U.S. Department of Labor must certify, that efforts to recruit U.S. workers were not successful. Employers must also pay a region-specific minimum wage—known as the Adverse Effect Wage Rate—that may not be lower than the average wage for crop and livestock workers in that region in the prior year, as measured in the Farm Labor Survey. In addition, employers must pay for application and visa processing fees, provide housing for their H-2A workers, and pay for their domestic and international transportation.
One of the clearest indicators that the supply of farm labor has declined is the number of H-2A positions requested and approved. These H-2A positions have increased fivefold in the past 14 years—from just more than 48,000 positions certified in fiscal year (FY) 2005 to nearly 258,000 in FY 2019 (see figure below). The average duration of an H-2A certification in FY 2019 was 5.3 months, representing the equivalent of 114,000 full-year jobs. In 2019, Florida, Washington, Georgia, California, and North Carolina had the most H-2A workers certified. These five States employed more than half of all H-2A workers certified nationally.
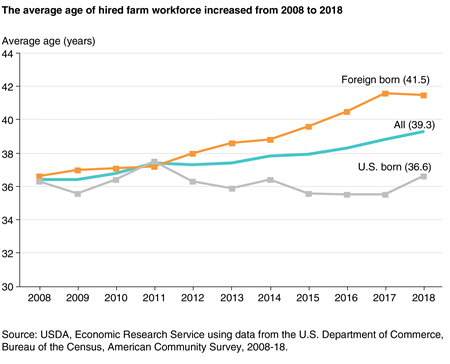
As fewer young immigrants have entered agriculture, the average age of foreign-born farmworkers has risen, pulling up the average age for the farm workforce. The average age of immigrant farmworkers increased by 5 years from 2008 to 2018 (see figure below), according to American Community Survey data from the U.S. Department of Commerce, Bureau of the Census. In contrast, the average age for farmworkers born in the United States has remained roughly constant over the same period.
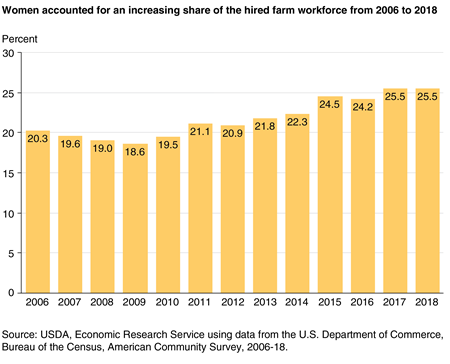
At the same time, more women have taken on farm work. From 2006 to 2009, the share of women farmworkers remained relatively unchanged, but then climbed from 18.6 percent in 2009 to 25.5 percent in 2018 (see figure below). One plausible explanation for this trend is that as labor costs rise, more growers adopt mechanical aids, such as hydraulic platforms that replace ladders in tree-fruit harvesting and mobile conveyor belts that reduce the distance heavy loads must be carried. These aids allow more women and older workers to perform tasks traditionally done by younger men.
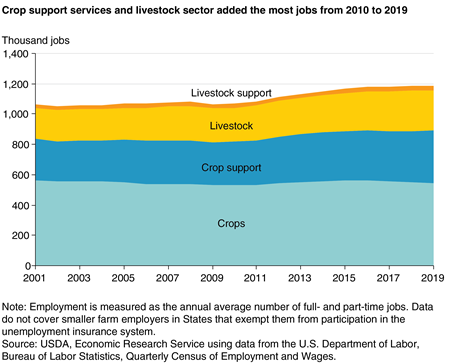
A decrease in the labor supply from Mexico and the associated labor market responses have occurred in the context of increasing farm employment, which suggests that labor demand has also increased. Data from the U.S. Bureau of Labor Statistics’ Quarterly Census of Employment and Wages shows that wage and salary employment in agriculture was stable in the 2000s but gradually increased from 1.07 million in 2010 to 1.18 million in 2019, a gain of 11 percent. Between 2010 and 2019, employment of direct hires in crop agriculture, the sector with the largest number of hired farm workers, remained essentially unchanged. Growth was fastest in crop support services—which added 56,000 jobs, a 20-percent increase—as employment of workers hired indirectly primarily through farm labor contractors increased (see figure below). Employment in the livestock sector also increased during the period (adding 39,400 jobs, an 18-percent increase).
Farm Labor, by Marcelo Castillo and Skyler Simnitt, USDA, Economic Research Service, August 2023
Farm Labor Markets in the United States and Mexico Pose Challenges for U.S. Agriculture, by Steven Zahniser, J. Edward Taylor, Thomas Hertz, and Diane Charlton, ERS, November 2018
U.S. Hired Farm Workforce Is Aging, by Thomas Hertz, USDA, Economic Research Service, May 2019
Rising Wages Point to a Tighter Farm Labor Market in the United States, by Steven Zahniser, J. Edward Taylor, Thomas Hertz, and Diane Charlton, USDA, Economic Research Service, February 2019
Farm Households Divide Their Time Between On-Farm and Off-Farm Labor, by Daniel Prager, USDA, Economic Research Service, December 2018