

Since 2009, Restaurant Prices Have Generally Risen Faster Than Grocery Store Prices

Food price analysis often focuses on foods purchased from grocery stores and other retailers for preparation at home (food at home). However, according to the Bureau of Labor Statistics’ 2015 Consumer Expenditure Survey, nearly half (43 percent) of the average American’s food expenditures is spent on food prepared by sit-down restaurants, fast food establishments, sandwich shops, and other eating places (food away from home).
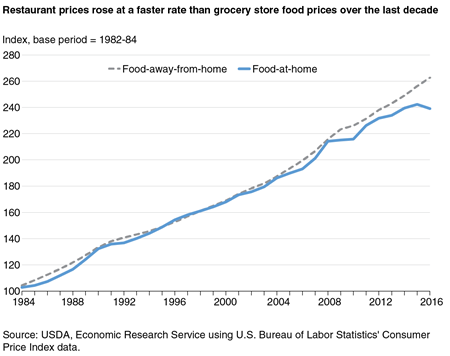
In general, food-away-from-home prices rise more consistently year to year than food-at-home prices. A price index that compares prices for a set “basket” of goods to a base period can be used to show the average change in prices over time. Charting the Consumer Price Indexes (CPI) for food away from home and for food at home since the base period, 1982-84, shows that over time, prices for food away from home and food at home trended upward at a fairly consistent rate until 2009. From 1984 to 2008, prices for both sectors rose at an average rate of 3.1 percent per year.
More recently, however, food-away-from-home prices have been rising faster than food-at-home prices. Food-away-from-home prices grew at an average annual rate of 2.5 percent between 2009 and 2016, versus food-at-home prices, which rose at an average rate of 1.4 percent per year over the same time period.
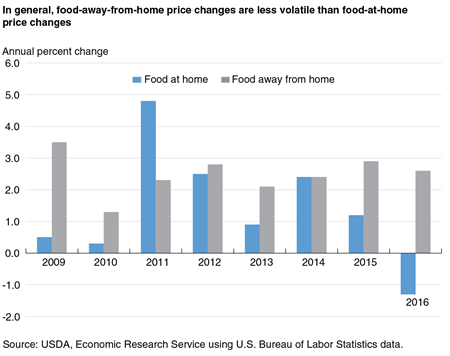
Food-at-home prices tend to be more volatile than food-away-from-home prices, and this was true during 2009 to 2016. Over this period, food-away-from-home prices rose between 1.3 and 3.5 percent per year. By contrast, food-at-home price changes during this time were more irregular, ranging from a 4.8-percent increase in 2011 to a decrease of 1.3 percent in 2016.
The year 2016 was a particularly interesting year. While food-away-from-home prices rose 2.6 percent on average, food-at-home prices declined 1.3 percent. This is the first time food-at-home prices have deflated since 1967. This means that food from grocery stores became less expensive, while food at restaurants continued rising in price.
ERS’s Food Dollar Series Highlights Differing Cost Structures for Food at Home and Away
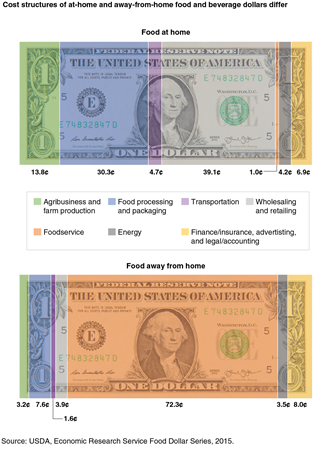
While it may seem that prices for food—whether purchased at a grocery store or restaurant—should move in the same direction, differences in the services provided by the two food sectors can, in part, explain the divergence in 2016. ERS’s Food Dollar Series apportions total annual expenditures by U.S. consumers on domestically produced food and beverages to 12 industry groups based on the value added by each industry. This division into industry groups highlights the differing cost contributions of industries involved in producing food at home and food away from home.
The largest two cost components of the at-home food and beverage dollar are food processing/packaging and wholesaling/retailing. Together these four industries accounted for 69.4 percent of a typical dollar spent on food and beverages in a grocery store in 2015. That is, for each dollar Americans spent at a grocery store in 2015, just over 69 cents was value added by the processing/packaging and wholesaling/retailing industries. Costs in these industries are driven by a combination of labor (processing plant workers and store managers and clerks), rental space (land or storefronts), and machinery maintenance.
In 2015, the value added by agribusiness and farm production accounted for 13.8 cents of the at-home food and beverage dollar, compared with 3.2 cents of the away-from-home food and beverage dollar. Thus, grocery store prices are more closely connected to farm-level prices than restaurant prices.
Gasoline or diesel fuel used for transporting food and fueling machinery throughout the food system is represented in the energy industry component of the food dollar. Energy accounted for a larger proportion of costs for food and beverages at home (4.2 percent) than for away-from-home food and beverages (3.5 percent) in 2015.
In contrast, the largest share of the away-from-home food dollar—72.3 cents in 2015—was spent on the services provided by foodservice establishments. The majority of the value added by foodservice establishments is in the form of salaries and benefits (including customer tips) of cooks, wait staff, dishwashers, and other employees involved in food preparation, meal service, or clean-up after the meal is finished. Salaries and benefits for the foodservice industry in the food-away-from-home market have been steadily increasing, from $193.7 billion in 2009 to $269.2 billion in 2015.
Falling Prices for Energy and Farm Products Helped Drive Down Food-At-Home Prices in 2016
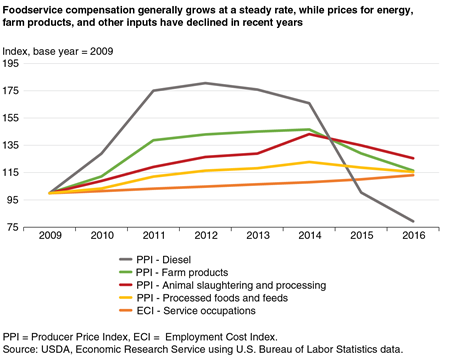
Lower farm commodity prices and lower energy costs contributed to lower at-home food prices in 2016; the Producer Price Index (PPI) for farm products declined 9.8 percent in 2016, and the PPI for diesel was 20.9 percent lower. The PPIs for processed foods and processing meats have also been trending downward in recent years.
Rising prices in the food-away-from-home sector, on the other hand, reflect the steady increase in costs associated with food service, most importantly in wages and employee benefits, as shown by the Employment Cost Index for Service Occupations, which grew by 13.1 percent from 2009 to 2016. These trends help explain the divergent paths of grocery store and restaurant prices in 2016, supported by the food and beverage dollar data.
Food Dollar Series, by Quinton Baker and James Chandler Zachary, USDA, Economic Research Service, November 2023
Food Price Outlook, by Matthew MacLachlan and Megan Sweitzer, USDA, Economic Research Service, April 2024