

SNAP Households Must Balance Multiple Priorities To Achieve a Healthful Diet
Highlights:
-
SNAP participants value nutrition as much as other consumers, but their time and money constraints complicate the task of making healthy food choices.
-
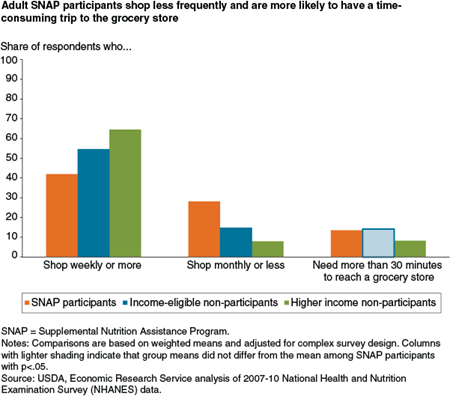
SNAP participants are more likely to shop just once a month and have a harder time getting to a grocery store.
-
Compared to other consumers, SNAP participants tend to be more pessimistic about the value of making dietary improvements.
The Supplemental Nutrition Assistance Program (SNAP), which has the goal of assisting Americans to purchase an adequate diet, is the largest of the Federal food and nutrition assistance programs and served more than 47 million Americans each month in fiscal 2013. Evidence shows that SNAP benefits help alleviate poverty and food insecurity among participating households. However, like most Americans, the dietary patterns of participating households show room for improvement, with adult participants typically under-consuming fruits, whole grains, and other healthy foods while consuming too many empty calories. Findings from behavioral economics pilot studies suggest that the manner in which food choices are presented can influence consumers’ decisions. These insights may help design more effective strategies to encourage SNAP shoppers to make more healthful food choices.
SNAP Participants Face Heightened Nutrition and Health Risks
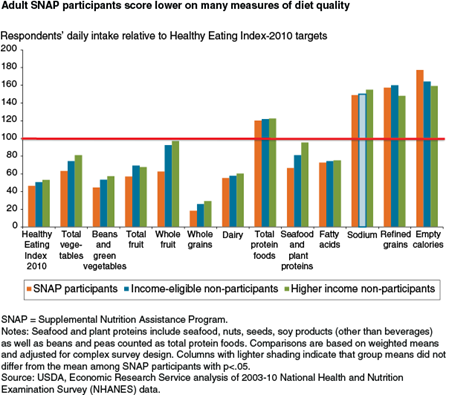
ERS researchers analyzed dietary intake data from the 2003-10 waves of the National Health and Nutrition Examination Survey (NHANES) to assess the diets of adult SNAP participants and other adult respondents relative to the 2010 version of the Healthy Eating Index (HEI). The HEI summarizes how closely one’s diet conforms to the Dietary Guidelines for Americans and is often used to compare diet quality across population subgroups. Total HEI scores reflect the daily intake of specific food group components, such as whole fruits, beans and green vegetables, whole grains, as well as intake of unsaturated fatty acids, sodium, and empty calories from added sugars, solid fats, and alcohol. Each component score is based on the amount consumed per 1,000 calories, also known as component density (an exception is the empty calories component which is assessed on the basis of the percentage of total calorie intake obtained from empty calories).
For the total HEI score and most component densities, higher scores reflect healthier diets. For healthy, underconsumed food groups such as fruits, they also indicate increased intake. However, for sodium, empty calories, and refined grains, which are consumed in higher-than-recommended amounts by most Americans, higher scores reflect a lower, more moderate intake than is typical. ERS analysis found that to meet the Dietary Guidelines most Americans need to consume more fruit; vegetables; whole grains; seafood; and plant proteins, such as dry beans, lentils and tofu; while cutting back on sodium, refined grains, and empty calories.
Total HEI scores for adult SNAP participants averaged 46 out of a possible 100 HEI points, compared to 50 for income-eligible adults not receiving SNAP benefits, and 53 for higher-income adults (those with household incomes that exceed 185 percent of the Federal poverty threshold). Adult SNAP participants scored lower on a number of components, and differences were most pronounced for whole fruits and empty calories. Sodium intake was the only HEI component on which SNAP participants outscored higher-income adults by consuming a less sodium-dense diet.
These findings are unsurprising—several studies have found that, compared to non-participants, SNAP participants tend to consume lower-quality diets. This is likely more attributable to the underlying socio-economic characteristics of SNAP participants rather than any effect of the SNAP program on food choices. Both income and education are strong predictors of diet quality, with higher income and education levels tracking with better diet quality. Surveys of SNAP households collected by USDA’s Food and Nutrition Service (FNS) consistently show that SNAP serves a very low-income population. FNS-sponsored analysis of NHANES data also show that SNAP participants are also more likely to only have a high school diploma or less compared to non-participants.
However, a prolonged low-quality diet is a concern because, over time, poor dietary patterns and excess consumption of empty calories can lead to diet-related health problems, weight gain, and obesity. Using the same NHANES data to compare mean values between SNAP participants and non-participants indicates that, on average, adults participating in SNAP have higher body mass indices (BMI) and are more likely than other adults to be overweight or obese. Compared to higher income respondents, they also report greater weight gain over the past year and are more likely to report having had heart disease, a stroke, or diabetes.
| Category | Mean values for SNAP participants (N=1,296) | Mean values for income-eligible non-participants (N=4,179) | Mean values for higher income non-participants (N=7,175) |
|---|---|---|---|
| Body Mass Index (BMI) | 30.9 | 28.5 | 28.4 |
| Share of population with BMI≥25 | 73.7% | 65.8% | 68.0% |
| Share of population with BMI≥30 | 46.7% | 34.7% | 33.1% |
| Share of population with reported history of heart disease | 7.7% | 8.4% | 5.1% |
| Share of population with reported history of stroke | 4.6% | 4.2% | 2.1% |
| Share of population that reported having diabetes | 10.4% | 9.9% | 6.8% |
| Average weight gain (lb) over past year | 2.3 | 0.5 | -0.5 |
| N = Number of respondents in subgroup. SNAP = Supplemental Nutrition Assistance Program. Note: Comparisons are based on weighted means and adjusted for complex survey design. Bolded values indicate that group means differ from the mean among SNAP participants with p<.05. Source: USDA, Economic Research Service analysis of 2003-10 National Health and Nutrition Examination Survey (NHANES) data. |
|||
SNAP Participants’ Knowledge of Recommended Food Choices Similar to Other Consumers
Public efforts to improve diet quality and health outcomes have typically relied on providing information on what constitutes a healthy diet and why it is important to have one. Through SNAP-Ed, the nutrition education and obesity prevention component of SNAP, USDA spent more than $400 million in fiscal 2014 on efforts to encourage SNAP participants to make healthier food purchases. In each State, SNAP-Ed agencies plan activities tailored to their community’s needs, ranging from classes on nutrition, food preparation, and food budgeting to targeted promotion efforts such as placing nutrition-related placards on bus routes in low-income neighborhoods.
How well improved dietary knowledge translates into better diet quality is unclear. To track variations in dietary knowledge and attitudes over time or across population subgroups, as well as to examine how these variations correlate with diet quality, ERS partnered with the National Center for Health Statistics to collect information on changes in nutrition-related knowledge, attitudes, and behaviors of U.S. consumers as part of the NHANES interview. Known as the Flexible Consumer Behavior Survey (FCBS), data from this ERS-sponsored NHANES module can help shed light on diet-health connections, especially in relation to nutrition assistance program participation, food shopping and expenditures, nutrition knowledge, and behaviors such as reading food labels. Questions about food spending were asked of an adult household respondent; questions on dietary knowledge and attitudes were asked of the respondent who furnished dietary intake data as part of a follow-up interview.
Consistent with their lower average diet quality and higher prevalence of a number of diet-related health outcomes, analysis of data from the 2007-10 FCBS indicates that adult SNAP participants are aware that their diets need improvement. SNAP participants are more likely to give low ratings to their own diet quality—40 percent indicate their diets need improvement, compared to 30 percent of lower income non-participants and 20 percent of higher income adults. They are also more likely to give low rankings to their own health status compared to either group of non-participants.
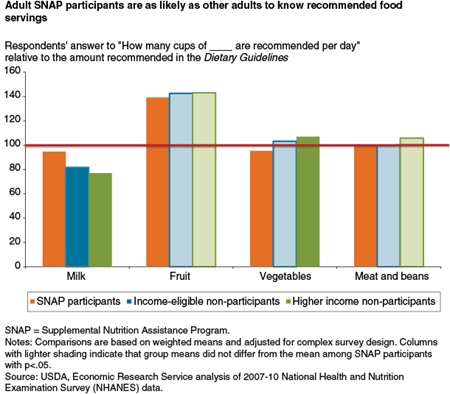
SNAP participants are less likely to have heard of the Dietary Guidelines, the Food Pyramid, or MyPyramid (now represented by MyPlate) than higher income individuals. At the time of these surveys (2005-10) less than half of adult SNAP respondents (45 percent) had heard of any of these programs compared to roughly two-thirds (67 percent) of higher-income shoppers. However, what they think they should be eating is no less accurate than higher-income respondents or income-eligible non-participants. In fact, when asked how many cups of milk and vegetables they should be consuming per day, SNAP participants were closer to being correct than higher income respondents.
SNAP participants were no less likely to report that they used the Nutrition Facts label or list of ingredients always or most of the time when purchasing food from grocery stores, although only a small share of any group of respondents (14-15 percent) reported checking the Nutrition Facts label that often. SNAP participants were more likely than higher income respondents to indicate they used front-of-package health claims always or most of the time—29 percent compared to 22 percent of higher income shoppers.
When Food Shopping, SNAP Participants Strive To Fulfill Multiple Priorities
When food shopping, taste rules. Regardless of SNAP participation or income, all respondents ranked taste as the most important factor influencing their decision. Nutrition was also important to the majority of shoppers, with SNAP and other low-income consumers more likely to rate it “very important” than higher income consumers. However, tighter constraints on food budgets and less easy access to food stores may partially explain why, compared to higher income adults, SNAP respondents were more likely to rank additional attributes as very important. How well a product keeps was rated as very important by 70 percent of SNAP respondents, the second most highly rated attribute among this group. A higher share of SNAP participants also indicated they place more importance on price and convenience compared to higher income shoppers.
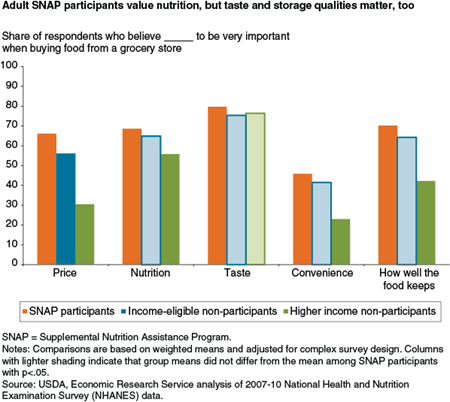
The higher value that SNAP shoppers placed on how well food keeps is understandable, given their shopping behavior as reported in the FCBS. Compared to higher income shoppers, SNAP shoppers are less likely to shop weekly and more likely to shop once a month or less. This may be related to the monthly distribution of SNAP benefits or to having a more difficult time getting to the grocery store—14 percent of SNAP respondents reported that it took them more than 30 minutes to get to a grocery store, whereas 8 percent of higher income shoppers needed that much travel time. When consumers shop less frequently, choosing foods that keep well would be important.
As expected, SNAP recipients reported spending less on food at the grocery store in the previous month than higher income households—$101.09 per person compared to $148.46 for higher income households. Their low income likely leads them to face many competing needs—rent, utilities, transportation, etc.—for their household budgets. SNAP benefits must be spent on food, and research shows that receiving SNAP benefits leads recipients to spend more on food at the grocery store. However, SNAP benefits can also free up some of the money previously spent on food for spending on other needs, resulting in a net increase in food spending of 17-47 cents for every dollar of SNAP benefits.
Given their budget constraints, the increased priority SNAP participants place on food prices is not surprising. Convenience often adds to the price of foods, and nutrition guides to food purchasing for low-income consumers typically recommend minimal use of convenience foods. ERS analysis of data from the American Time Use Survey, administered by the U.S. Bureau of Labor Statistics, found that lower income women spend more time on food preparation than do higher income women, and although both groups decrease time spent on cooking when they work outside the home, the decrease is smaller for lower income women.
While SNAP benefits cannot be used to purchase food away from home, participants can use their own money for such items. FCBS data show that SNAP households spend less on eating out and carryout/delivery food than do other households—$21.25 per person over a 30-day period, lower than the $39.67 per person reported by income-eligible non-SNAP households and $93.58 per person reported by households of higher income adults. Eating more restaurant and carryout food may save food preparation time, but is more expensive. The income constraints that push SNAP consumers to spend more time on food preparation may lead them to prize convenience to the extent that it is affordable.
SNAP Participants May Be More Pessimistic About the Value of Dietary Change
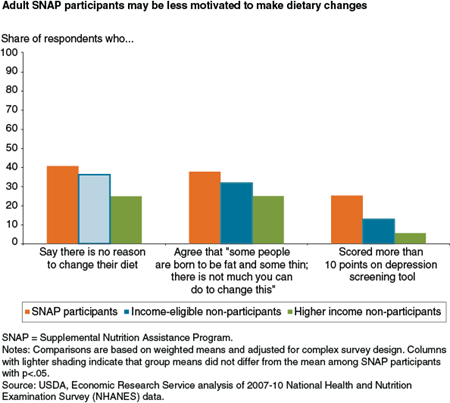
In addition to practical constraints of access, time, and budget, SNAP participants may be more pessimistic than other consumers about the value of dietary change. Despite the fact that both observed and perceived diet quality is lower among SNAP participants compared to higher income shoppers, SNAP participants are less likely to feel the need to change their diets. Forty percent of SNAP participants indicated that they felt no need to change their diets; in contrast, only 25 percent of higher-income shoppers felt no need to make dietary changes.
SNAP participants were also more likely than other respondents to agree with the statement 'some people are born to be fat and some thin; there is not much you can do to change this”—37 percent compared to 31.5 percent of low-income non-participants and 25 percent of higher income adults. This may indicate differences in perceptions of self-efficacy among SNAP participants compared to higher-income shoppers. Alternatively, it may be that the other stresses of living in poverty make maintaining diet and health as a top priority more difficult.
Additional findings from analysis of NHANES data indicate that SNAP participants feel more depressed than others, which may add to feelings of pessimism and discourage efforts to make dietary improvements. Beginning in 2005, adults and adolescents responded to a nine-item screening instrument about the frequency of depressive symptoms over the past 2 weeks, and the overall impairment of these symptoms. Response categories 'not at all,' 'several days,' 'more than half the days,' and 'nearly every day' were given a score ranging from 0 to 3. A total score was calculated ranging from 0 to 27. A score of 10 or higher is commonly used in clinical studies to define depression. Analysis of responses among adults show that, on average, SNAP participants scored higher on this screening tool, 6.3 compared to 3.9 for low-income non-participants and 2.7 for higher income adults. Twenty-five percent of SNAP participants scored 10 or higher, compared to 13 percent of income-eligible non-participants and 5 percent of higher income adults.
Strategies To Help SNAP Shoppers Balance Competing Priorities May Be Useful
Attempting to balance nutrition goals with competing constraints—time, distance to grocery stores, and money—may make it harder for SNAP shoppers to make healthy choices, while pessimism may further discourage the effort. These findings suggest that strategies that make it easier for SNAP shoppers to balance competing priorities and reinforce the value of dietary improvement may enhance the effectiveness of nutrition education efforts. For example, USDA, in partnership with the U.S. Departments of Treasury and Health and Human Services, has provided grants to local organizations to provide expanded access to healthy foods by starting new stores and farmers’ markets in low-income neighborhoods or by improving the healthfulness of offerings by existing retailers. Such efforts to decrease the time and travel costs of food shopping and increase the feasibility of shopping more frequently may alleviate concerns about how well food keeps and encourage SNAP shoppers to purchase increased amounts of healthy perishables, such as low-fat milk, fresh fruits, and vegetables.
Additionally, nutrition guides emphasizing healthy foods that keep well (such as frozen vegetables) and efforts to improve the nutritional quality of convenient shelf-stable foods (such as by decreasing sodium in canned soups, tomato sauces, and other foods) may benefit SNAP recipients and others that depend on foods with a long storage life.
SNAP participants are more likely than others to report using front-of-package health claims, possibly because this reduces the time and effort required to search out nutrition information. Well-designed front-of-package or shelf-label statements or symbols may be especially helpful to them. Researchers found that one supermarket chain’s shelf label system, which assigned stars to more nutritious items, led to increased purchases of healthier breakfast cereals.
Behavioral economics theories suggest that when consumers have many competing preferences such as weighing the immediate benefits of taste and convenience against the long-term payoffs from making healthy choices, the manner in which the choices are presented—known as the choice architecture—can subtly influence choice to better align with longer-term health objectives. ERS-supported research in school cafeterias has found that small changes in how foods are presented can lead children to select and consume more of the healthy foods offered as part of USDA-funded school meals. ERS, in partnership with FNS, is now beginning to explore whether behavioral economics-based strategies can also be used to encourage SNAP shoppers to make healthier food choices.
In September 2014, ERS and FNS established a new university-based USDA Center for Behavioral Economics and Healthy Food Choice Research. The Center is a partnership between Duke University and the University of North Carolina at Chapel Hill. The USDA Center, funded at $1.9 million for fiscal years 2015-18, will facilitate new and innovative research on the application of behavioral economics theory to promote healthy food choices at supermarkets and grocery stores, with a particular focus on low-income households and individuals that participate in SNAP and the Special Supplemental Nutrition Program for Women, Infants and Children (WIC), another major USDA food assistance program. The aim is to find strategies to make the healthy, economical choice the easiest choice for program participants.
SNAP Benefits Alleviate the Intensity and Incidence of Poverty, by Laura Tiehen and Michele Ver Ploeg, USDA, Economic Research Service, June 2012
Can Low-Income Americans Afford a Healthy Diet?, by Elise Golan, Hayden Stewart, Fred Kuchler, and Diansheng Dong, USDA, Economic Research Service, November 2008
“Effects of the Guiding Stars Program on Purchases of Ready-To-Eat Cereals with Different Nutritional Attributes” by Ilya Rahkovsky, Biing-Hwan Lin, Chung-Tung Jordan Lin and Jonq-Ying Lee, Food Policy 43:100-107, October 2013
Who Has Time To Cook? How Family Resources Influence Food Preparation, USDA, Economic Research Service, May 2007