

Less Eating Out, Improved Diets, and More Family Meals in the Wake of the Great Recession

Highlights:
-
In response to the 2007-09 Great Recession, U.S. households cut their spending on a number of consumables, including meals and snacks away from home.
-
Working-age adults ate food prepared away from home less frequently, cut caloric intake, and improved their diet quality.
-
Improved diet quality is not fully explained by decreased eating out; greater focus on nutrition, and perhaps improved nutritional quality of foods available, also contributed to diet quality.
The Great Recession of 2007-09 was by most accounts the deepest recession in the postwar WWII period, and many of its effects have lingered beyond its official end in June 2009. Seasonally adjusted unemployment, which stood at 5.0 percent at the recession’s start, doubled to its peak of 10.0 percent in October 2009. As of December 2013, 4 1/2 years after the recession’s official end, unemployment was 6.7 percent. Along with decreased employment came reductions in earnings. Between 2007 and 2012, average U.S. household annual income fell from $55,627 to $51,017.
Consumers have strong food preferences and slow-to-change eating habits, making short-term economic downturns less likely to alter food choices. The size and severity of the Great Recession provided an opportunity to learn how relatively large changes in employment and income affect food purchase decisions and, in turn, dietary quality.
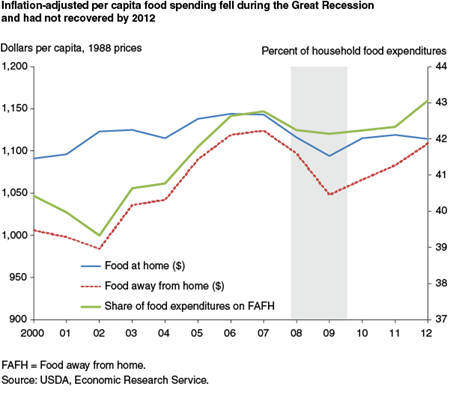
One way that households compensate for reduced earnings is to reduce expenditures, especially on discretionary or luxury goods. While food is a necessity, eating out is not. Between 2006 and 2009, households cut their inflation-adjusted spending on food prepared outside the home by 12.9 percent, about eight times the 1.6-percent decrease in at-home food spending. Inflation-adjusted per capita spending on both at-home and away-from-home food were still below pre-recession levels in 2012.
A decline in eating-out expenditures may not necessarily result in a decline in calories from food away from home or an improvement in dietary quality. Households may reduce their eating out budgets by choosing less expensive options when dining out rather than reducing the frequency and/or the quantity consumed. Moreover, substitution to less expensive away-from-home options may lead to lower overall diet quality if the cheaper options are less nutritious.
Looking at intake rather than just expenditures reveals that working-age Americans cut back on the number of meals and snacks eaten away from home between 2005-06 and 2009-10, and total daily calories from food away from home as well as its share of daily calories declined. Overall diet quality of working-age adults improved slightly. A lower share of their calories came from fat and saturated fat, and they consumed less cholesterol and ate more fiber. While the decline in eating out was responsible for some of this improvement, consumers making healthier food choices and using nutrition information when food shopping, combined with a greater supply of healthier choices, also likely led to improvements in diet quality during this period.
Food Away From Home Tends To Lower Diet Quality
Food prepared outside the home, or food away from home (FAFH), comprises a significant share of Americans’ food expenditures and intake. Prior to the Great Recession, FAFH as a share of total intake was on the rise. From 1970 until 2006, the share of household food expenditures on FAFH increased from 26 to 43 percent, while the share of calories from FAFH also increased, from 18 percent in 1977-78 to 32 percent in 2006.
Previous ERS research has shown that FAFH tends to be of lower nutritional quality—containing more total fat, saturated fat, sodium, cholesterol, and less fiber and calcium—than food prepared at home. Bigger portion sizes, richer sauces, and “May I show you the dessert menu?” when eating out may be responsible for the lower nutritional profile of FAFH. In addition, people may tend to splurge on foods that they would not normally prepare at home when eating out.
Even after controlling for individual tastes and preferences, which likely influence diet quality and the decision to consume FAFH, consumption of FAFH increases total caloric intake and reduces diet quality among adults and children. A 2010 ERS study found that each additional FAFH meal increased average daily calorie intake of adults by 134 calories. FAFH also reduced fruit and vegetable intake of adults and increased the share of calories consumed from solid fat, added sugar, and alcohol. Thus, a shift away from FAFH may have positive impacts on diet quality and diet-related health outcomes.
Meals and Snacks Away From Home Declined, as Did Calories
Detailed individual dietary intake data from three rounds of the National Health and Nutrition Examination Survey (NHANES) provided a unique perspective on how food intake evolved before (2005-06), during (2007-08), and after (2009-10) the Great Recession. Although these survey rounds do not perfectly correspond to the recession’s start and end dates (December 2007 to June 2009), they do correspond fairly well to the pre-recession period of low unemployment, rising unemployment during the recession, and prolonged high unemployment following the end of the recession.
For this analysis, FAFH sources include full-service restaurants, fast-food and pizza places, bars and lounges, sporting venues, vending machines, soup kitchens/shelters/food pantries, meals on wheels, street vendors and food trucks, residential dining facilities, and any other source not considered to be an at-home source. Researchers focused on the cohort of adults born between 1946 and 1985, who were of working age over the entire study period (age 20-59 in 2005-06). This group of adults was the most likely to have been affected by rising unemployment during and after the recession, and thus the most likely to have altered their eating patterns in response to changes in their employment status.
Although the Great Recession was officially over in June 2009, changes in consumption patterns of working age adults were largest between 2005-06 and 2009-10 as compared to 2005-06 and 2007-08. This is consistent with the fact that average unemployment was highest in 2009-10, while in 2007-08, it was just slightly higher than in 2005-06. Working age adults’ consumption of FAFH declined in terms of total daily calories, the share of daily calories, and the number of meals and snacks from FAFH.
For adults born between 1946 and 1985, daily caloric intake declined from 2,328 calories in 2005-06 to 2,210 calories in 2009-10, a decrease of 118 calories. Part of this decline in caloric intake can be attributed to an increase in age among this cohort and other small shifts in demographic characteristics. Once these changes are accounted for, the estimated change in caloric intake fell to 78 calories per day, or 3.4 percent relative to 2005-06. This estimate did not change even after also controlling for income. Working-age adults also ate out less often, consuming about 12 percent fewer FAFH meals and snacks per day. Correspondingly, total daily calories from FAFH fell by 127 calories between 2005-06 and 2009-10, and the share of calories from FAFH declined from 34.7 to 30 percent. This decline was not just from eating less at full-service restaurants. Total calories from fast food and pizza places (a subset of all FAFH) fell by 53 calories, and the share of calories from fast food declined from 14.4 to 12.6 percent. In contrast, caloric intake and the number of meals and calories from FAFH did not change among older adults (those born before 1946) over the period.
In addition to trimming calories, diet quality—as measured by fat, cholesterol, and fiber intake—improved over the period of study. The share of calories from fat declined by 3.3 percent between 2005-06 and 2009-10, and the share of calories from saturated fat fell by 5.9 percent. Intake of cholesterol declined by about 24 milligrams per day, while fiber intake increased by 1.2 grams per day. Older adults reduced their intake of saturated fat and cholesterol to a lesser degree.
| Daily intake | 2005-06 (average per day) |
2009-10* (average per day) |
Percent change from 2005-06 to 2009-10 |
|---|---|---|---|
| Total calories (number) | 2,328 | 2,250 | -3.4 |
| Calories from fat (percent) | 33.8 | 32.7 | -3.3 |
| Calories from saturated fat (percent) | 11.3 | 10.6 | -5.9 |
| Cholesterol (number of milligrams) | 308 | 284 | -7.9 |
| Fiber (number of grams) | 16.1 | 17.3 | 7.5 |
| FAFH meals (number) | 0.87 | 0.77 | -11.5 |
| FAFH snacks (number) | 0.41 | 0.36 | -12.2 |
|
Calories from FAFH (number)
|
833 | 706 | -15.2 |
|
Calories from FAFH (percent)
|
34.7 | 30.0 | -13.7 |
|
Calories from fast food (number)
|
351 | 298 | -15.2 |
|
Calories from fast food (percent)
|
14.4 | 12.6 | -12.7 |
| *Estimated after accounting for changes in age and other demographic characteristics between 2005-06 and 2009-10 in the cohort of adults born between 1946 and 1985. All changes are statistically significant with p<0.05. Note: FAFH = Food away from home. Source: USDA, Economic Research Service using data from the 2005-06 and 2009-10 National Health and Nutrition Examination Survey. |
|||
Consumers Paid More Attention to Nutrition and Chose Healthier Foods
Were the lower FAFH intakes observed between 2005-06 and 2009-10 responsible for these dietary improvements? Or, did individuals make wiser food choices, both at and away from home? To answer these questions, researchers used statistical models to separate the change in diet quality attributable to the decline in FAFH intake from other unobserved factors. Researchers found that fewer FAFH meals and snacks explained only a small share of the total change in diet quality over the period—15.1 percent of the decline in the share of calories from total fat, 6.9 percent of the decline in saturated fat consumption, 13.8 percent of the decline in cholesterol intake, and 11.1 percent of the increase in fiber intake.
Between 2005-06 and 2009-10, the quality of food from both at-home and away-from-home sources improved in terms of saturated fat and fiber, while FAFH also improved in terms of cholesterol. The share of calories from saturated fat in food at home declined by half a percentage point, while the share in FAFH declined 0.3 percentage points. In addition, for every 1,000 calories of at-home food, individuals were consuming 1.17 additional grams of fiber in 2009-10 as compared to 2005-06. The increase in fiber for FAFH was lower, at 0.43 grams per 1,000 calories. In 2009-10, working-age adults consumed 13.65 fewer milligrams of cholesterol per 1,000 calories of FAFH than they did in 2005-06.
These improvements in the quality of food at home and FAFH could be due to consumers making more healthful food choices and/or an improvement in the quality of foods available. A 2008 study by ERS researchers found that the increase in consumption of whole grains in recent years can be attributed to both an increase in consumer demand as well as an increase in the availability of whole-grain products, through new products and reformulations of existing foods.
Responses to questions in the Flexible Consumer Behavior Survey (FCBS), a part of NHANES, indicate that both working-age and older adults increased their attention to nutrition and their use of nutrition information when shopping for food during the study period. Among working-age adults, 34 percent used the Nutrition Facts label always or most of the time in 2007-08, versus 42 percent in 2009-10. Among older adults, the share went from 51 to 57 percent between the two periods. Use of health claims 'always' or 'most of the time' increased from 18 to 31 percent for working-age adults and from 36 to 47 percent for older adults. In 2009-10, as compared to 2007-08, working-age and older adults were less likely to think that being thin or fat is just something people are born with, suggesting that more individuals recognize weight is within an individual’s control.
Increased Family Meals: Another Positive Change
Time available for preparing meals at home also likely increased during and after the Great Recession. In addition to an increase in the share of workers unemployed, the number of individuals actually in the labor force declined—from 154.3 million in 2008 to 153.6 million in 2011. With less time dedicated to paid work, individuals and households could opt to spend more time preparing food and eating together as a family.
In 2007-08 and 2009-10, as part of the FCBS, individuals were asked about family meals —meals eaten with a majority of household members. Among the working-age subsample that lives with children under age 17, the number of family meals increased from 5.80 to 6.29 per week, and the number of family meals prepared at home increased from 5.35 to 5.77 per week. Older adults also reported consuming more family meals per week and more family meals prepared at home. In 2007-08, this group reported an average of 8.25 family meals per week (7.60 prepared at home), which increased to 9.13 family meals per week (8.48 prepared at home) in 2009-10.
This increase in family meals, especially meals cooked at home, may have additional positive benefits aside from the immediate effect on diet quality and related health. For example, a study reported in the Archives of Pediatric and Adolescent Medicine found that family meals are associated with improved adolescent psychological development.
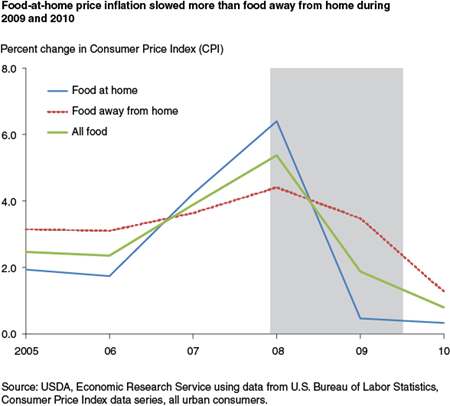
Prices of food at home and FAFH also influence how consumers allocate their food budgets between home-prepared meals and FAFH. At the start of the recession, consumers faced food-at-home prices that were increasing more rapidly than FAFH prices. Beginning in 2009, food-at-home prices were relatively stable, while FAFH prices continued to increase. In 2009 and 2010, at-home food prices rose by less than 1 percent both years, while FAFH prices went up 3.5 and 1.3 percent, respectively. Thus, in addition to lower incomes and greater time available for preparing food, price changes during 2009 and 2010 would have reinforced a move toward more at-home eating and less eating out.
Looking Ahead: Eating Out Likely To Rebound, but Improved Diet Quality May Be Here To Stay
Between 2005-06 and 2009-10, Americans experienced large changes in employment and income—changes that affected their food expenditures and intake. Once changes in age and other demographic characteristics that are unrelated to the recession are controlled for, FAFH calories among working-age adults declined about 15 percent, while the number of meals from FAFH declined 12 percent.
The fact that a decline in FAFH consumption was only observed among working-age adults, and not among older adults, suggests that the recession was a large factor influencing where working-age adults obtained their food. However, the fact that accounting for household income did not affect the estimated change in FAFH consumption over the period suggests that the recession effect was not mainly through income, but through other channels such as increased time available for shopping and preparing food at home.
Researchers also found that most of the improvements in diet quality were not a result of the decline in FAFH consumption. The quality of at-home and away-from-home foods improved, perhaps from consumers focusing more on nutrition when selecting foods. Whether or not these changes are a result of the recession or are due to other factors cannot be determined with the data. However, the fact that improved diet quality was observed among older adults and that they also reported greater attention to nutrition information suggests that this nutrition focus is not simply the result of higher unemployment. Food manufacturers may also be responding in part to consumer demand for nutrition by improving the nutritional content of foods that they produce.
As the U.S. economy recovers from the recession and people spend more time working, FAFH consumption is likely to increase to its prerecession level and may even continue its gradual increase over time. However, diet quality may not decline if consumers continue to pay closer attention to the nutritional quality of the food they consume, including when they eat out. Menu labeling requirements mandated by the 2010 Affordable Care Act will make it easier for consumers to identify lower calorie and otherwise healthier away-from-home foods.
The Affordable Care Act requires restaurant chains with more than 20 locations to list the caloric content of each standard item on menus or menu boards and let consumers know that additional nutritional information is available in written form. Restaurants are likely to respond to these labeling requirements by reformulating some of their offerings, just as food manufacturers responded to the recommendations in the 2005 Dietary Guidelines to increase consumption of whole grains. When intake data for 2011 and beyond becomes available, and after the national menu labeling rules are finalized and implemented, we may see further improvements in the nutritional quality of FAFH and the choices consumers make when eating away from home.
The Impact of Food Away From Home on Adult Diet Quality, by Jessica E. Todd, Lisa Mancino, and Biing-Hwan Lin, USDA, Economic Research Service, February 2010
Nutritional Quality of Food Prepared at Home and Away From Home, 1977-2008, by Biing-Hwan Lin and Joanne Guthrie, USDA, Economic Research Service, December 2012
Food Spending Adjustments During Recessionary Times, by Aylin Kumcu and Phillip Kaufman, USDA, Economic Research Service, September 2011
“Getting consumers to eat more whole-grains: The role of policy, information, and food manufacturers”, Food Policy, 33(6), pp. 489-496, February 2008
Food Choices & Health, by Sabrina Young, USDA, Economic Research Service, March 2023