

Agricultural Productivity Growth in the United States: 1948-2011
U.S. total farm production more than doubled between 1948 and 2011. Agricultural output growth was mainly driven by productivity growth, with little contribution from total agricultural inputs growth. The United States ranks first in world arable land area and third in world population. In 2012, the U.S. agricultural exports accounted for nearly 12 percent of world exports and its agricultural imports accounted for nearly 9 percent of the world's total imports. Because the United States is one of the world’s largest producers and consumers of agricultural commodities, sustained growth of U.S. agricultural productivity is critical to both domestic and global food security. If U.S. agricultural productivity growth fails to keep pace with increasing global food demand, this could lead to rising food prices and may put pressure on low-income households as they spend a greater share of their income on food.
Productivity can be measured based on a single factor, such as yield (total crop production per unit of land) or labor productivity (total production per unit of labor). However, single factor productivity measures are sensitive to changes in the use of other inputs and do not necessarily reflect overall technological advancement. For example, yield and labor productivity can both increase as more fertilizer and pesticides are used, even in the absence of improved production techniques. The USDA’s Economic Research Service (ERS) has monitored the farm sector’s productivity performance for decades and was the first federal agency to routinely publish statistics based on a broad agricultural productivity measure that reflects all inputs—total factor productivity (TFP). Annual TFP growth is the difference between growth of agricultural output and growth of all inputs taken together, thus isolating changes in productivity from changes in the overall use of inputs.
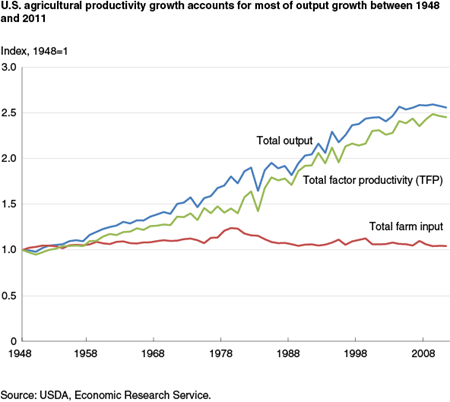
According to newly revised and updated productivity statistics, U.S. agricultural output grew at an average annual rate of nearly 1.5 percent from 1948 to 2011. With total input use growing an average of less than 0.1 percent per year, TFP growth, at an annual average rate of slightly more than 1.4 percent, accounted for most of the increase in U.S. agricultural output. While aggregate input growth has been relatively stable over this period, the composition of agricultural inputs has shifted. Between 1948 and 2011, labor use declined by 78 percent (at an average annual rate of -2.4 percent); land input dropped by 26 percent (at an average annual rate of -0.5 percent); while consumption of intermediate goods, such as energy, agricultural chemicals, purchased services, seed and feed, grew by 140 percent (1.3 percent per year); and capital (excluding land) increased by 65 percent (0.8 percent per year).*
While TFP growth has been the primary source of growth in agricultural output in the United States, its role and that of each of the major input components—labor, land, intermediate goods, and capital—have changed over time. ERS reports measures of growth for the period 1948 to 2011 and in subperiods of one business cycle peak to the next. The contraction in labor input contributed negatively to output growth over the entire 63-year period and each of the subperiods. This was especially significant in the 1950s and 1960s when labor moved from the farm sector into manufacturing and construction as post-World War II economic growth drew large numbers of workers into these sectors. On average, the decrease in labor use contributed -0.5 percentage points annually to output growth. In most subperiods, changes in land use also contributed negatively to output growth, resulting in a long-term annual average decline in output of -0.08 percentage points. On the other hand, the growth of intermediate goods and capital (excluding land) contributed a combined 0.64 percentage points to average annual output growth, more than offsetting the negative impact from reductions in labor and land use.
| Measure | 1948- 2011 |
1948- 53 |
1953- 57 |
1957- 60 |
1960- 66 |
1966- 69 |
1969- 73 |
1973- 79 |
1979- 81 |
1981- 90 |
1990- 2000 |
2000- 07 |
2007- 11 |
|---|---|---|---|---|---|---|---|---|---|---|---|---|---|
| Output growth | 1.49 | 1.08 | 0.94 | 3.87 | 1.20 | 2.27 | 2.68 | 2.26 | 1.54 | 0.99 | 1.86 | 0.78 | -0.27 |
| Sources of growth | |||||||||||||
| Inputs | 0.07 | 0.78 | 0.27 | 0.67 | 0.17 | 0.73 | 0.39 | 1.63 | -2.52 | -1.20 | 0.04 | 0.47 | -1.30 |
| Labor | -0.50 | -0.79 | -1.07 | -0.83 | -0.81 | -0.61 | -0.38 | -0.19 | -0.22 | -0.43 | -0.34 | -0.34 | -0.26 |
| Capital (excluding land) | 0.01 | 0.56 | 0.16 | 0.03 | 0.08 | 0.32 | 0.14 | 0.32 | 0.23 | -0.61 | -0.21 | 0.05 | 0.05 |
| Land | -0.08 | 0.02 | -0.16 | -0.16 | -0.06 | -0.21 | -0.27 | 0.00 | -0.12 | -0.09 | 0.00 | -0.07 | -0.02 |
| Intermediate goods | 0.63 | 1.01 | 1.34 | 1.62 | 0.97 | 1.24 | 0.90 | 1.49 | -2.40 | -0.05 | 0.60 | 0.83 | -1.06 |
| Total Factor Productivity | 1.42 | 0.30 | 0.66 | 3.21 | 1.03 | 1.54 | 2.29 | 0.63 | 4.06 | 2.19 | 1.82 | 0.31 | 1.03 |
| Note: The subperiods are measured from cyclical peak to peak in aggregate economic activity. Source: USDA, Economic Research Service. |
|||||||||||||
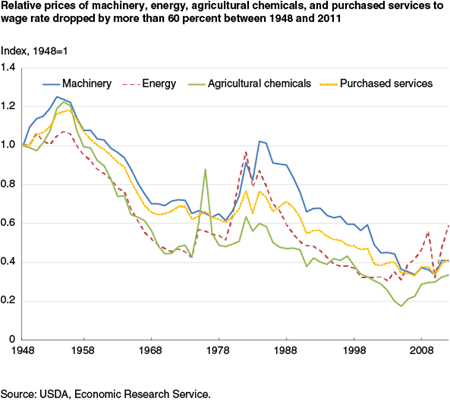
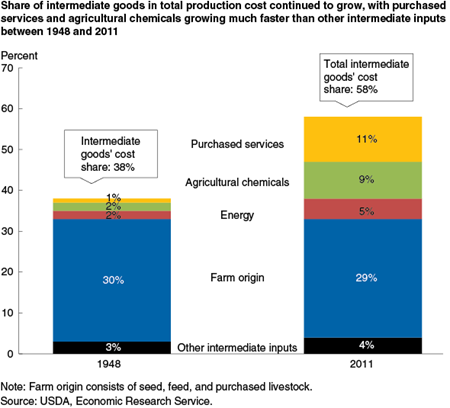
The shift in the input mix away from labor and toward machinery and intermediate inputs—including energy, agricultural chemicals, purchased services, and other materials—reflects trends in relative prices, as the prices of those factors dropped significantly relative to labor between 1948 and 2011. While the size of the farm sector’s labor force declined over time, farm wage rates increased to remain competitive with those in other sectors with similar skill requirements. In response to higher wages, famers implemented labor-saving practices, such as using more farm machinery, fertilizers, and pesticides. Between 1948 and 2011, the cost of intermediate goods as a share of total production costs increased, except for farm origin inputs (seed, feed, and purchased livestock), which maintained a fairly constant 30-percent share of costs. The most significant changes include those for agricultural chemicals, increasing from 2 to 9 percent of the cost share, and purchased services, which increased from 5 to 11 percent of total production cost.
Although the substitution of intermediate goods and capital helped to offset the impact of reduced labor and land use on output before 1980, growth of those inputs has slowed since then. In the last three decades, TFP growth accounted for almost all output growth. TFP growth reflects innovations, mainly driven by research funding, that enable continuing output growth without adding inputs. During 1981-1990, when no input category expanded, farm production still grew at nearly 1 percent annually, as TFP grew at 2.19 percent per year. More recently, in 2007-2011, declining inputs contributed -1.3 percentage points per year to total output growth, but TFP growth, at 1.03 percent, kept output growth to a -0.27 percentage point decline per year.
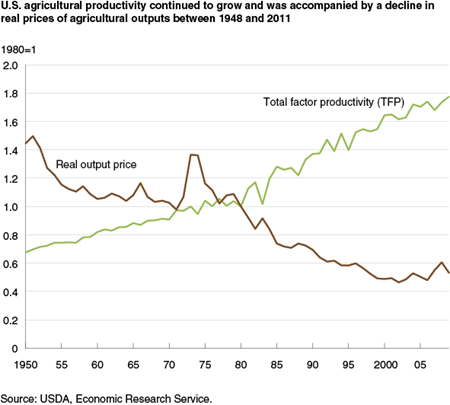
Long-term growth in TFP has promoted sustained agricultural output growth, even with declines in labor and land devoted to agricultural production. Over time, productivity growth has also led to declining real (i.e. inflation-adjusted) agricultural output prices, making food and fiber more affordable. This is evidenced by the decline in agricultural output prices relative to the U.S. economy’s overall price level. Since 1948, real agricultural output prices have fallen, except during the energy price shocks of the early 1970s and, to a lesser extent, in 2007. The principal drivers of productivity growth are public and private research expenditures. With public research funding under fiscal budgetary pressure, the ability of U.S. agriculture to maintain its record of productivity growth in the future remains an open question deserving of close monitoring and analysis.
*On February 4, 2014, the last sentence of the third paragraph was revised to state that capital (excluding land) increased by 65 percent (0.8 percent per year).
Agricultural Productivity in the U.S., by Sun Ling Wang, Eric Njuki, Richard Nehring, and Roberto Mosheim, USDA, Economic Research Service, January 2024