

New International Evidence on Food Consumption Patterns: A Focus on Cross-Price Effects Based on 2005 International Comparison Program Data

Much has been written about the recent volatility in food prices and the negative impact on food security in the lowest-income countries, where households spend a large share of their income on food. But prices of non-foods—energy, housing, transportation, etc.—have also been subject to extreme fluctuations, and food and nonfood prices do not necessarily move in the same direction. An effective policy response to the full range of possible economic shocks requires an understanding of potential shifts in consumer demand in response to changes in both food and nonfood prices. As one indicator for such potential shifts in consumption patterns, ERS estimated a set of cross-price elasticities using 2005 data from the International Comparison Program (ICP), currently housed by the World Bank. These cross-price elasticities of demand represent a consistent set of cross-country, cross-price elasticities for 144 countries and 9 consumption categories, the largest set of its kind available.
Cross-price elasticities describe the change in demand for one good in response to a price change in another good. For example, if transportation prices increase, how will that impact the demand for food? These cross-price elasticities provide an empirical measure of the actual response to price changes and are thus valuable inputs for economic models used to capture the effects of shocks on different sectors of the economy. ERS estimated cross-price elasticities across 144 countries for food relative to nonfood sectors as a whole, as well as for 9 broad consumption categories: food, beverage, and tobacco; clothing and footwear; gross rent, fuel, and power; household furnishings and operations (which includes spending on household equipment and its maintenance); medical and health; transport and communications; recreation; education; and “other.”
An increase in food prices affects consumers in two different ways. It makes nonfood relatively more attractive, resulting in substitution away from food towards nonfood. At the same time, however, more expensive food lowers real income, which in turn will cause demand for all goods to decline. Elasticities estimated by ERS measure both effects. Our results show that in 2005 the net effect of price increases of non-food was a decline in food demand for all countries.
The 144 countries in the 2005 ICP data are divided into low-, middle-, and high-income countries based on their real per capita gross domestic product (GDP) relative to that of the United States, which has the highest GDP of all 144 countries. Countries with real per capita income less than 15 percent of the U.S. level were designated as low-income, those with real per capita income equal to or greater than 15 percent but less than 45 percent of the U.S. level were designated as middle income, and high-income countries include those with real per capita income equal to or greater than 45 percent of the U.S. level. Households in lower income countries spend a much higher share of their incomes on food than those in the other two groups.
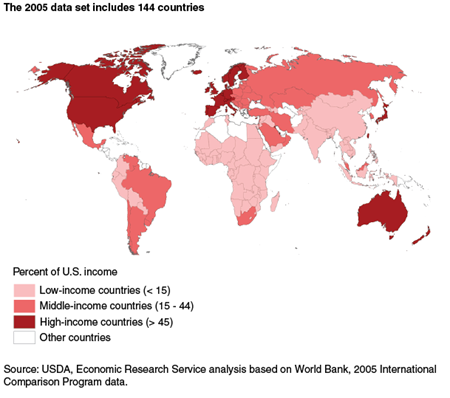
| Income level | Number of countries | Average income as share of U.S. income* (percent) | Food budget share |
|---|---|---|---|
| Low income | 77 | 5.8 | 48.5 |
| Middle income | 38 | 25.8 | 30.7 |
| High income | 29 | 63.8 | 20.4 |
| *Income is on a per capita basis. Source: USDA, Economic Research Service based on International Comparison Program data for 2005. |
|||
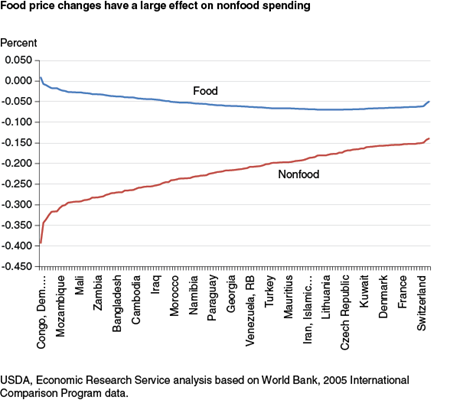
The top blue line in figure 2 represents the change in food spending in response to changes in nonfood prices, while the red line represents changes in non-food spending in response to food price changes. These lines represent uncompensated elasticities, which means they capture the substitution response to a change in relative prices as well as the response to a change in real income due to higher prices. Nonfood cross-price elasticities are much larger than the food cross-price elasticities—6 times larger for low-income countries and 2.7 and 2.4 times larger for middle- and high-income countries. This finding implies that food price changes can have a relatively large effect on nonfood spending.
The cross-price elasticities in the two-good demand system indicate that the cross-price elasticity for food with respect to a change in the nonfood price is higher in middle-income countries than in low- and high-income countries. The poorest countries have relatively low budget shares for nonfood; all spending must be considered as essential, which means that movement across spending categories will be minimal. High-income countries, however, have relatively large nonfood budgets. At the same time, their food needs are generally met, which makes food spending less responsive to nonfood price changes.
| Slutsky (compensated) | Clothing & footwear | Housing | House furnishings | Medical & health | Transport & communications | Recreation | Education | Other |
|---|---|---|---|---|---|---|---|---|
| Percent change in other budget with percent change in food prices, compensated elasticity | ||||||||
| Low-income average | 0.28 | 0.31 | 0.30 | 0.56 | 0.35 | 0.90 | 0.27 | 0.59 |
| Middle-income average | 0.15 | 0.16 | 0.16 | 0.20 | 0.18 | 0.22 | 0.14 | 0.20 |
| High-income average | 0.08 | 0.08 | 0.08 | 0.10 | 0.09 | 0.10 | 0.07 | 0.10 |
| Source: USDA, Economic Research Service, based on International Comparison Program data for 2005. | ||||||||
Table 2 shows how changes in food prices affect spending on eight major consumption categories. A low elasticity for clothing and footwear, for example, implies that an increase in the price of food will have relatively little impact on the demand for this category, implying that it is considered necessary spending. Interestingly, for the first time, Education elasticities are lower than those for Clothing and footwear for all income groups, which shows that education spending is increasingly viewed as a necessity.
New International Evidence on Food Consumption Patterns: A Focus on Cross-Price Effects Based on 2005 International Comparison Program Data, by Birgit Meade, Anita Regmi, James L. Seale, Jr., and Andrew Muhammad, USDA, Economic Research Service, January 2014
2005 International Comparison Program, Tables of final results, World Bank, February 2008