

ERS’s Food Loss Data Help Inform the Food Waste Discussion

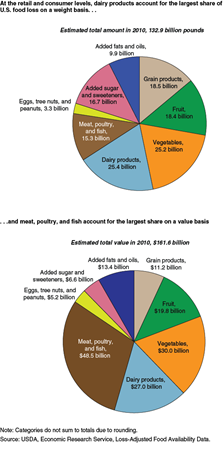
Food loss and food waste are becoming increasingly important issues as the world’s population grows and as pressures on agricultural land and other resources increase. ERS researchers calculate that at the retail and consumer levels, an estimated 133 billion pounds, or 31 percent of the 430 billion pounds of food available for human consumption in the United States in 2010, was not eaten. At 2010 retail prices, this translates into $161.6 billion worth of food. The estimate would have been higher if it accounted for losses at the farm and between the farm and retail level. However, not all uneaten food is recoverable, or recoverable in a cost-effective manner. Some amount of food loss is necessary to provide an affordable, diverse, and safe food supply. Identifying how much and where food loss occurs in the food system is the first step in efforts to reduce food waste.
ERS’s Food Availability Data System includes the Loss-Adjusted Food Availability (LAFA) data series that adjusts national estimates of food supplies for nonedible parts of foods (bones, peels, etc.) and losses from farm to fork. The LAFA series is considered a work-in-progress because ERS continues to refine the underlying loss assumptions and estimates. Researchers used the loss adjustments for the 215 foods in the LAFA series to calculate amounts and values of each food lost at the retail and consumer levels in 2010. Retail losses include dented cans, unpurchased holiday foods, spoilage, and the culling of blemished or misshaped foods. Consumer losses include spoilage, cooking shrinkage, and plate waste.
On a weight basis, the estimated combined retail and consumer losses were split fairly evenly across six of the nine major food groups, with eggs, the added fats and oils group, and the tree nuts and peanuts group having smaller loss shares. The size of the losses reflects both the relative amounts of food sold and prepared as well as loss-related characteristics, such as perishability, consumers’ tastes and preferences, and consumers misjudging the amount of food to buy or prepare.
| Food group | Food supply1 | Retail level losses from food supply (billion pounds) | Retail level losses from food supply (percent) | Consumer level losses from food supply (billion pounds) | Consumer level losses from food supply (percent) |
|---|---|---|---|---|---|
| Grain products | 60.4 | 7.2 | 12 | 11.3 | 19 |
| Fruit | 64.3 | 6.0 | 9 | 12.5 | 19 |
| Fresh | 37.6 | 4.4 | 12 | 9.5 | 25 |
| Processed | 26.7 | 1.6 | 6 | 2.9 | 11 |
| Vegetables | 83.9 | 7.0 | 8 | 18.2 | 22 |
| Fresh | 53.5 | 5.2 | 10 | 12.8 | 24 |
| Processed | 30.4 | 1.8 | 6 | 5.3 | 18 |
| Dairy products | 83.0 | 9.3 | 11 | 16.2 | 20 |
| Fluid milk | 53.8 | 6.5 | 12 | 10.5 | 20 |
| Other dairy products | 29.1 | 2.8 | 10 | 5.7 | 19 |
| Meat, poultry, and fish | 58.4 | 2.7 | 5 | 12.7 | 22 |
| Meat | 31.6 | 1.4 | 4 | 7.2 | 23 |
| Poultry | 22.0 | 0.9 | 4 | 3.9 | 18 |
| Fish and seafood | 4.8 | 0.4 | 8 | 1.5 | 31 |
| Eggs | 9.8 | 0.7 | 7 | 2.1 | 21 |
| Tree nuts and peanuts | 3.5 | 0.2 | 6 | 0.3 | 9 |
| Added sugar and sweeteners | 40.8 | 4.5 | 11 | 12.3 | 30 |
| Added fats and oils | 26.0 | 5.4 | 21 | 4.5 | 17 |
| Total | 430.0 | 43.0 | 10 | 89.9 | 21 |
| Note: Categories do not sum to totals due to rounding. 1Food supply at the retail level, which is the foundation for the retail- and consumer-level loss stages. Source: USDA, Economic Research Service, 2010 ERS Loss-Adjusted Food Availability data as of Sept. 17, 2012, and the U.S. population on July 1, 2010 (309.75 million). |
|||||
On a value basis, the loss shares shift somewhat. The meat, poultry, and fish group, which had the sixth largest loss share by weight (12 percent), has the largest share (30 percent) in terms of estimated value, reflecting this group’s higher cost per pound relative to the other groups and other factors, such as cooking shrinkage (e.g., fat drained off ground beef during cooking). Vegetables and dairy products, which both had 19-percent loss shares on a weight basis, had loss shares of 19 percent and 17 percent, respectively, on a value basis. Loss shares for added sugars and sweeteners and grain products were smaller when expressed on a value basis than as a weight.
At the consumer level, the LAFA series reveals that on a per person basis, 290 pounds, or 0.8 pounds per day, of food was not eaten in 2010. This is valued at $371, or 9.2 percent of the $4,016 average amount spent on food per person in 2010. Meat, poultry, and fish; vegetables; and dairy products accounted for 68 percent of the annual loss.
Some food loss is inevitable because shrinkage is a natural process in cooking, food is inherently perishable, and some losses—like the discard of opened food containers and moldy fruit at the supermarket—are necessary to ensure the safety and wholesomeness of the food supply. Likewise at restaurants, plate scraps not taken home by patrons are appropriately discarded as a health consideration. The costs and resources used to recover and transport wholesome food must also be considered when developing cost-effective ways to reduce food waste. Awareness of the scope and sources of food loss may result in new government policies, enhanced food-handling practices and technologies, behavioral changes among consumers, or other actions that reduce food waste and conserve resources.
Food Availability (Per Capita) Data System, by Linda Kantor and Andrzej Blazejczyk , USDA, Economic Research Service, April 2023
“Total and Per Capita Value of Food Loss in the United States”, Food Policy, 37(5):561-570, October 2012, by Jean C. Buzby, and Jeffrey Hyman, www.sciencedirect.com/science/article/pii/S0306919212000693
“The Value of Retail- and Consumer-Level Fruit and Vegetable Losses in the United States", The Journal of Consumer Affairs, 45(3):492-515, September 2011, by Jean C. Buzby, Jeffrey Hyman, Hayden Stewart, and Hodan F. Wells, http://onlinelibrary.wiley.com/doi/10.1111/j.1745-6606.2011.01214.x/pdf