

Americans’ Food Choices at Home and Away: How Do They Compare With Recommendations?

Highlights:
-
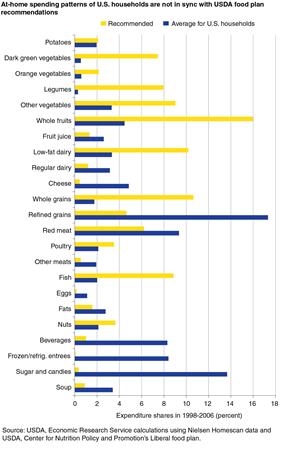
Grocery purchase data reveal that consumers underspend on fruits, vegetables, and whole grains and overspend on refined grains, fats, and sugars/sweets, compared with USDA food plan recommendations, a pattern that showed little change from 1998 to 2006.
-
Food consumption data point to an even bigger challenge to improving diet quality: away-from-home foods now account for one-third of daily caloric intake, and they are not as healthful as at-home foods.
-
New Government and private industry initiatives to make food labels and point-of-purchase information more relevant, understandable, and motivating may help consumers choose more healthful foods.
In 1980, the Federal Government issued the Dietary Guidelines for Americans, a guide to healthy eating for consumers. Though the Dietary Guidelines have been widely promoted and updated every 5 years to keep pace with advances in nutrition knowledge, Americans still make poor dietary choices. Compared with recommendations, most Americans consume too few fruits, vegetables, and whole grains and too much saturated fat and sodium. Poor diets contribute to obesity, heart disease, stroke, cancer, diabetes, osteoarthritis, and other health conditions that impose economic costs through increased health care expenditures and lost productivity, making dietary improvement an important public priority.
Measured against the Dietary Guidelines recommendations, two recent ERS studies find that consumers are underspending on vegetables, fruit, whole grains, and low-fat dairy and overspending on refined grains, fats, sweets, and convenience foods in the grocery store. Food choices when eating away from home are even more of a nutritional concern. Policies that promote healthy foods and make them easier to identify on store shelves and in restaurants may expand both demand for and supply of healthy food options.
What’s in the Grocery Cart?
A healthy diet is the result of a chain of consumer decisions extending from food purchase to consumption. Despite the increasing popularity of restaurant and takeout meals, Americans still obtain about two-thirds of their daily calories from food prepared at home. So, the purchasing choices they make when shopping at the grocery store are the first step to a healthy diet.
ERS researchers compared grocery store purchases as recorded by Nielsen Homescan panelists in 1998-2006 with USDA food plan recommendations. USDA food plans provide spending guidelines for obtaining a diet that meets the Dietary Guidelines. There are different versions of the USDA food plans (Thrifty, Low cost, Moderate cost, and Liberal) adapted to spending patterns of consumers at different income levels and tailored to the number and age of individuals in a given household. The plans identify nutritionally appropriate shares or percentages of a household’s total food expenditures for 23 broad categories of foods typically bought by American consumers.
The Homescan dataset consists of a sample of U.S. households who record their food and beverage purchases from all retail stores. ERS researchers organized over 60,000 different products into the 23 USDA food plan categories. A handful of categories--frozen or refrigerated entrees and dinners, refined grains, whole grains, dairy products, and soups--contain most of the processed products in the grocery cart, while the other categories are composed of fresh or minimally processed products like frozen green beans or canned tomatoes. The beverage category includes soft drinks, fruit drinks, and other beverages but not milk or fruit juice.
Spending patterns of Homescan participants were compared with recommendations in the Liberal food plan, designed for households facing the least restrictive budget constraints. The average income of the Homescan panel households was between $45,000 and $50,000 per year for 1998-2006, compared with the national median household income of $43,318 in 2003.
Findings reveal that consumer spending came close to matching USDA food plan recommendations for only 1 of the 23 food categories examined--potatoes. The food plan recommends 2.1 percent of a family’s food expenditures be spent on potatoes, and the Homescan panelists were found to have spent 2.0 percent. Panelists underspent on all categories of vegetables except potatoes. For example, they spent only 0.5 percent of their food budgets on dark green vegetables, while the food plan recommended 7 percent. Panelists also underspent on whole grains, whole fruit, lower fat dairy, nuts, poultry, and fish.
Panelists overspent on other foods such as refined grains, fruit juices, regular dairy products (including whole milk and butter), and meats. Refined grains--which include non-whole grain crackers, cookies, breads, and pasta--accounted for 17 percent of the panelists’ spending instead of the 5 percent recommended in the USDA food plan. Dietary guidance suggests limiting added fats and sugars, and USDA food plan expenditure levels are correspondingly low, but the Homescan panelists’ expenditures for these categories were well above recommendations. Spending on convenience options, such as frozen or refrigerated entrees, was also higher than recommended.
A comparison of actual to recommended purchasing patterns shows that U.S. consumers’ food choices are out of sync with Federal dietary guidance. But, are there subgroups of Americans who are especially unlikely to meet the recommendations? To compare overall purchasing patterns of households in different economic and demographic subgroups, researchers calculated an overall score for each Homescan household based on how its shopping habits, on a quarterly basis, compared with USDA-recommended expenditure shares.
Scores indicate that dietary quality is a general problem in the U.S. and is not confined to a particular economic or demographic group. Differences in household scores across racial groups, regions of the country, and income groups are relatively small, and all groups are in need of improvement. For example, scores rose slightly with household income, and at the extreme ends of the income distribution (annual incomes below $12,000 and above $200,000), average scores differed by 18 percent. Nevertheless, both groups’ scores indicated food purchasing patterns that were far from ideal when compared with recommendations.
Food Spending Patterns Changed Little Over Time
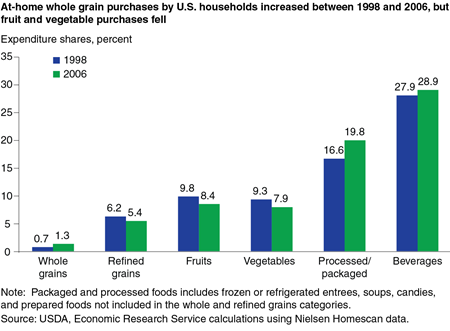
The average quarterly grocery cart did not improve noticeably in healthfulness between 1998 and 2006, with the exception of an increase in the share of spending on whole grains, coupled with a decreased share of spending on refined grains. The average Homescan household spent 1.3 percent of its food expenditures on whole grains in 2006, up from 0.7 percent in 1998. The expenditure share for refined grains fell from 6.2 percent to 5.4 percent over the 9 years. In 2005, the Dietary Guidelines recommended that whole grains should account for half of all grain consumption, and the food industry responded by providing more whole grain products. The combined effect of these two factors may have influenced consumers’ purchases.
On a less positive note, Homescan panelists allocated less of their food budgets to fruits and vegetables and more to packaged and processed foods and beverages in 2006 than in 1998. Expenditure shares for fruits and vegetables each fell by 1.4 percentage points over the period, while the expenditure share for packaged and processed foods rose by 3.2 percentage points.
Eating Out Requires Smart Choices, Too
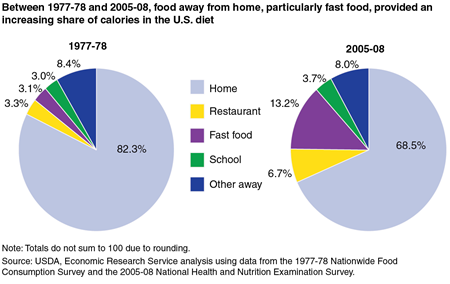
Despite this discouraging picture, ERS analyses of food consumption surveys find that the nutritional content of food prepared at home is superior in many ways to the foods we eat away from home. This difference in healthfulness is the result of what type of food is offered, what food is selected, how the food is prepared, and how much of the food is eaten. For example, baked potatoes are more commonly eaten at home, while less nutritious fried potatoes are a restaurant staple. And, we are eating out more. In 2005-08, Americans consumed 32 percent of their daily calories away from home, up from 18 percent in 1977-78.
ERS researchers analyzed the foods people reported eating in two national surveys conducted in 1977-78 and 2005-08. Nutrient data for those foods were computed by USDA researchers using recipes that best met food descriptions supplied by survey respondents, including information on the source of food (home foods versus foods from restaurants, fast food places, and other away-from-home locations), method of preparation (such as fried versus grilled), quantity consumed, and accompaniments (for example, sour cream and butter on a baked potato versus just salt and pepper).
According to the surveys, Americans have made some positive nutrition changes at home but less so when eating out. In 1977-78, the total fat content of food consumed at home and food away from home was virtually the same, at 39.6 and 39.9 percent of calories, respectively. By 2005-08, the fat content of at-home food had dropped to 30.5 percent of calories, within the 20-35 percent of calories range recommended by the Institute of Medicine of the National Academies, while that for away-from-home food changed little and stood at 37.2 percent. At-home foods also became more calcium-rich between the two survey periods. For each 1,000 calories consumed at home, Americans increased their calcium intake from 425 milligrams (mg) to 559 mg. Over the same period, the calcium density of food away from home grew only slightly, from 452 mg to 460 mg per 1,000 calories.
In 2005-08, USDA researchers expanded the nutrient analysis to include estimates of the amounts of saturated fat, sodium, and dietary fiber in at-home and away-from-home foods. Again, away-from-home foods were less consistent with dietary recommendations than at-home foods and were higher in saturated fat and sodium and lower in dietary fiber.
Overall, Americans obtained 11.4 percent of their calories from saturated fat in 2005-08, on average, slightly higher than the recommended 10 percent. Food at home averaged 10.7 percent of calories from saturated fat, closer to the recommendation than the 12.4 percent average for food away from home. The saturated fat content of foods obtained from fast food restaurants (13.5 percent of calories) was higher than that from other away-from-home sources.
The 2010 Dietary Guidelines recommends consuming no more than 2,300 mg of sodium daily. USDA’s Healthy Eating Index-2005 identifies intakes of 1,100 mg of sodium per 1,000 calories as appropriate for meeting this recommendation. Neither at-home nor away-from-home food consumption met this recommended level in 2005-08, although at-home foods came closer than away-from-home foods. Foods from restaurants and fast food establishments were particularly sodium-dense.
Low intakes of dietary fiber--typically found in fruit, vegetables, and whole grains--have been identified as a public health concern. The Institute of Medicine’s recommended adequate intake (AI) of dietary fiber is 14 grams per 1,000 calories. For the total diet, fiber density in 2005-08 averaged slightly more than half the recommended level--7.2 grams per 1,000 calories. The fiber density of food at home was higher than that of food away from home, mostly due to the low fiber density of fast food.
| Category | Saturated fat as share of calories (percent) | Sodium density (mg/1,000 kcal) | Dietary fiber (g/1,000 kcal) |
|---|---|---|---|
| Total diet | 11.4 | 1,536 | 7.2 |
| Food prepared at home | 10.7 | 1,369 | 7.7 |
| Food prepared away from home | 12.4 | 1,820 | 6.8 |
|
Restaurant
|
11.9 | 2,151 | 7.5 |
|
Fast food
|
13.5 | 1,864 | 5.9 |
|
School
|
12.3 | 1,609 | 7.7 |
|
Others
|
11.3 | 1,591 | 7.7 |
Note: All food sources are statistically different from each other in saturated fat, sodium, and fiber content in pair-wise comparisons at the 5-percent probability level, except for:
|
|||
Can Expanded Information and Product Innovation Improve Food Choices?
Clearly, there is room for improvement in Americans’ food choices both at home and away from home. At the grocery store, consumers are underspending on vegetables, fruit, whole grains, and low-fat dairy and overspending on refined grains, fats, sweets, and convenience foods. This pattern is reflected in dietary intakes that are high in saturated fat and sodium and low in dietary fiber. Food prepared away from home--at restaurants, fast food places, and other locations--tends to be even further away from Federal dietary recommendations.
Supply and demand both play a role in influencing consumer food choices, as illustrated by the recent trend toward increased availability and purchases of whole grains. Increased emphasis on the health benefits of whole grains likely caught the attention of both the food industry and consumers. This growing interest in whole grains led food companies to expand supply by offering a wider range of whole grain products, and consumers, in turn, increased purchases. Further success in changing dietary habits may depend on increasing consumer demand for healthful foods and the ability of industry to find products with improved health characteristics that also meet consumer preferences for convenience and taste.
Affordability is another key consideration. The perceived high cost of healthy foods is often cited by consumers as a deterrent to purchasing them, yet recent ERS research found that healthy foods like fruits and vegetables can cost less per portion than less healthy foods. Nevertheless, consumers may need to shift purchases away from foods for which they are overspending relative to the USDA food plans to free up funds for purchases of healthful, underconsumed foods.
Despite the benefits to overall diet quality, it can be difficult to convince consumers to change food preferences. General nutrition education messages that illustrate the types and quantities of food that should be eaten every day can increase consumer awareness of the basics of a healthy diet. In addition, nutrition labeling of specific items and point-of-purchase messages can provide more specific information and top-of-mind awareness at the moment consumers make actual food choices. Nutrition labeling of packaged foods sold in the grocery store has been mandatory since the mid-1990s and may have influenced the decline in fat content of home-prepared foods. However, an ERS analysis of Federal consumer surveys conducted in 1995-96 and 2005-06 found that use of nutrition labels declined between the two time periods, especially among young adults. The data did not permit identification of the reasons for this decline; the authors suggested that young adults might use nutrition labels less, in part, because they were not exposed to the informational campaigns that introduced the labels.
New Government and private industry initiatives are striving to make food labels and point-of-purchase information more relevant to consumer interests, readily comprehensible, and motivating. The U.S. Food and Drug Administration, which regulates nutrition labeling of foods, has announced its intention to propose changes to existing practices. These include modifying the Nutrition Facts panel that appears on packaged foods to make it more useful to consumers and exploring how front-of-package labeling can help consumers choose more healthful diets.
Some food retailers have already begun using shelf tags and front-of-package labels to help consumers identify more healthful food products. For example, in the Guiding Stars program now found in many supermarkets, shelf tags display one, two, or three stars based on a product’s nutrition profile. NuVal, another shelf-labeling system, rates foods from 1 to 100 based on overall nutritional characteristics. And Walmart places its “Great for You” logo on packaged foods in its “Great Value” line that meet nutrition standards based on the Dietary Guidelines.

Efforts such as these by retailers may encourage food companies to reformulate their products to make them more healthful. ERS researchers found that adding trans fat content information to the Nutrition Facts panel in 2006 spurred both the use of front-of-package claims publicizing foods that were trans fat free and the introduction of new trans fat-free products. If consumers respond to shelf tags and logos highlighting healthier items, more such products will likely be developed.
Marketing efforts may also need to address factors other than nutrition that prompt consumer food choices. The nutritional benefits of vegetables and fruits are well known, yet, as shown in the ERS analysis of Homescan purchases, expenditures declined for these products between 1998 and 2006 and rose for packaged foods, suggesting that preferences for nutrition and convenience may be in conflict. Innovations that simplify and speed food preparation, such as pre-washed, peeled, and/or chopped vegetables, are becoming popular and may partially address this need.
Menu Labeling May Change Away-From-Home Choices
The limited amount of nutrition information provided for foods offered at restaurants, fast food establishments, and other away-from-home locations may explain why consumers tend to choose less nutritious items at these places. A 2010 Federal law requires restaurant and fast food chains with at least 20 locations to post calorie information on menu boards or in menus and to make additional nutrition information, such as saturated fat and sodium content, available on request. While the final regulations for menu labeling are not yet in place, some restaurants and fast food establishments have already begun to provide nutrition information for their menus.
Will menu labeling improve food choices? Studies examining the effects of local menu labeling laws have generally concluded that menu labeling had a small effect on consumer behavior. Additional nutrition education efforts and point-of-purchase messages raising awareness of the importance of away-from-home eating as a part of the daily diet may increase consumer response to menu labeling. Menu labeling may also prompt restaurants to offer more healthful options and to reformulate current offerings. A recent RAND Corporation study found that California restaurants were particularly likely to reformulate items high in calories, fat, or sodium in response to the implementation of a State menu labeling law in 2010.
Behavioral economics has demonstrated the power of defaults in guiding choice. For example, if a restaurant’s “meal deal” includes a large beverage, a customer may be inclined to take it even if he or she typically orders a smaller beverage. To harness the power of defaults, public health advocates have urged restaurants and fast food places to make their healthier options, such as low-fat milk and apple slices, the default choice in children’s meals, and several restaurants and fast food establishments have done so.
Improving food choices at home or away from home requires a dynamic interplay between supply and demand. On the supply side, producers, food companies, and eating places can effect change by providing foods that are nutritious but also tasty, convenient, and affordable.But even if these options are available and plentiful, their impact depends on the choices consumers make. Policies promoting interest in healthy foods and ways to accurately identify them may increase consumers’ demand for these foods and improve diets and health.
Assessing the Healthfulness of Consumers' Grocery Purchases, by Richard Volpe and Abigail Okrent, USDA, Economic Research Service, November 2012
Nutritional Quality of Food Prepared at Home and Away From Home, 1977-2008, by Biing-Hwan Lin and Joanne Guthrie, USDA, Economic Research Service, December 2012
Are Healthy Foods Really More Expensive? It Depends on How You Measure the Price, by Andrea Carlson and Elizabeth Frazão, USDA, Economic Research Service, May 2012
The Decline in Consumer Use of Food Nutrition Labels, 1995-2006, by Jessica E. Todd and Jay Variyam, USDA, Economic Research Service, August 2008
New Food Choices Free of Trans Fats Better Align U.S. Diets With Health Recommendations, by Ilya Rahkovsky, Stephen Martinez, and Fred Kuchler, USDA, Economic Research Service, April 2012
Will Calorie Labeling in Restaurants Make a Difference?, by Rosanna Mentzer Morrison, Lisa Mancino, and Jay Variyam, USDA, Economic Research Service, March 2011