


Canada: Trade & FDI
Canada: Trade
Canada is a major participant in international agricultural trade. In 2022, Canada’s total global agricultural exports to all countries equaled about $66.0 billion and corresponding imports totaled $48.4 billion—applying the World Trade Organization’s (WTO) definition of “agricultural products” to the Canadian Government’s trade statistics. The United States is Canada's largest agricultural trading partner, buying 59.2 percent of Canadian exports and supplying 57.0 percent of Canadian imports. In addition, Canada is also the leading agricultural trade partner of the United States, when exports and imports are combined. In 2022, Canada accounted for 14.5 percent of U.S. agricultural exports and 18.8 percent of imports (again using the WTO definition of “agricultural products”).
The heightened level of integration between the United States’ and Canada’s agricultural sectors is partly due to the Canada-U.S. Free Trade Agreement (CUSTA), which was implemented in 1989 and subsumed by the North American Free Trade Agreement (NAFTA) in 1994. From 1989 to 1998, CUSTA and NAFTA dismantled virtually all tariff and quota barriers to Canada-U.S. agricultural trade, with a few notable exceptions, including U.S. imports of dairy products, peanuts, peanut butter, cotton, sugar, and sugar-containing products as well as Canadian imports of dairy products, poultry, eggs, and margarine.
In November 2018, the Canadian, Mexican, and U.S. Governments signed the United States-Mexico-Canada Agreement (USMCA) to replace NAFTA. The entry-into-force date for USMCA was July 1, 2020. In general, USMCA continues NAFTA’s provisions for tariff- and quota-free trade for almost all agricultural products traded between the United States and Canada, while offering broader market opportunities for U.S. exports to Canada of dairy, poultry, and egg products.
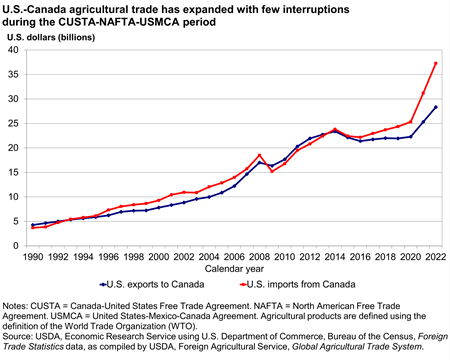
Canada-U.S. agricultural trade has expanded almost without interruption during the CUSTA-NAFTA-USMCA period. Between 1988—the last year prior to implementing CUSTA—and 2021, U.S. agricultural exports to Canada and agricultural imports from Canada each expanded at a compound annual rate of 7.9 percent. The major exceptions to this pattern of growth occurred in 2009, following the economic downturn of 2007–09 and from 2015–20, due to a decline in many commodity prices.
Download chart data in Excel format
Much of Canada-U.S. agricultural trade consists of intra-industry trade, meaning that each country exports products to the other within certain sectors. In grains and feeds, intra-industry trade encompasses numerous processed products, including dog and cat food for retail sale; mixes and doughs; pastries, cake, bread, and pudding; breakfast cereal; and uncooked pastas. Beef and pork are prominent examples of intra-industry trade outside the grains and feeds sector.
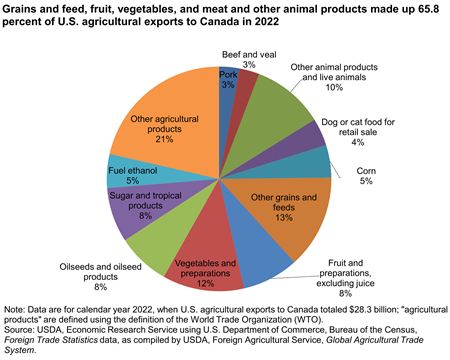
Grains, fruit, vegetables, meat, and related products accounted for nearly two-thirds (65.8 percent) of U.S. agricultural exports to Canada in 2022. Among the leading exports were fuel ethanol ($1.4 billion); corn ($1.3 billion); dog or cat food for retail sale ($1.1 billion); pork ($832 million); and beef and veal ($811 million).
Download chart data in Excel format
Detailed table on selected U.S. agricultural exports to Canada
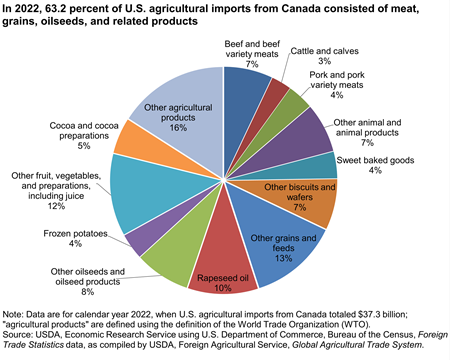
In 2022, 63.2 percent of U.S. agricultural imports from Canada consisted of meat and other animal products, grains and feeds, and oilseeds and oilseed products. The leading agricultural imports in 2022 were biscuits and wafers ($4.2 billion), followed by rapeseed oil ($3.8 billion), beef and beef variety meats ($2.6 billion), cocoa and cocoa preparations ($1.9 billion), pork and pork variety meats ($1.4 billion), and frozen potatoes ($1.4 billion).
Download chart data in Excel format
Detailed table on selected U.S. agricultural imports from Canada
Canada: FDI
Foreign Direct Investment Into Canada
Foreign direct investment (FDI)—defined by the United Nations as “investment made to acquire a lasting interest in or effective control over an enterprise operating outside of the economy of the investor”—is another type of economic linkage that binds the agricultural, food, and beverage sectors of Canada and the United States. In all sectors of the economy at the end of 2021, Canada was the third largest destination for U.S. direct investment abroad (after the European Union and United Kingdom), with a total U.S. direct investment position of about $374 billion, according to FDI data on a historical cost basis from the U.S. Department of Commerce’s Bureau of Economic Analysis (BEA). BEA defines “direct investment position at historical cost” as a “measure of the value of direct investors’ equity in, and net outstanding loans to, their affiliates in which the direct investors’ investment is valued at book value. It largely reflects prices at the time of the investment rather than prices of the current period and is not ordinarily adjusted to reflect the changes in the current costs or the replacement costs of tangible assets or in stock market valuations of firms.”
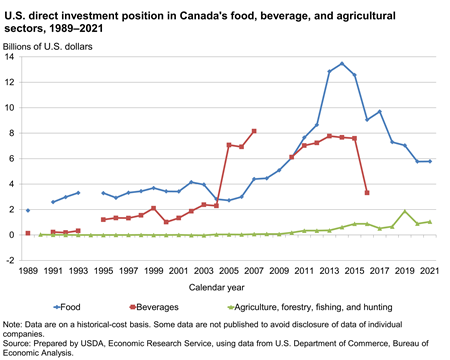
U.S. direct investment in Canada's food industry is also substantial. At the end of 2021, Canada was the third largest destination for U.S. direct investment in the food industry (after the European Union and the United Kingdom). During the 3–year period of 2019–21, the U.S. direct investment position in Canada’s food industry averaged $6.2 billion annually. Of this average, fruit and vegetable preserving and specialty foods accounted for 43 percent, and grain and oilseed milling accounted for 29 percent. Between 2014 and 2021, U.S. direct investment in Canada’s food industry decreased by nearly $7.7 billion, largely due to a decline in the U.S. direct investment position in the fruit and vegetable preserving and specialty foods sector. In general, mergers and acquisitions involving large firms can result in substantial year-to-year changes in specific industries in the U.S. direct investment position in Canada and the Canadian direct investment position in the United States.
Download chart data in Excel format
The current size of U.S. direct investment in Canada's beverage industry is not known publicly because annual observations for this sector for 2017–21 are suppressed to avoid disclosing information that would identify the activities of an individual company. The most recent data—for 2016—suggest that the U.S. direct investment position in Canada’s beverage industry may be in the neighborhood of $3 billion.
In the Canadian agriculture, forestry, hunting, and fishing sectors, the U.S. direct investment position in Canada was just over $1.0 billion in 2021. Almost all of this investment was in crop production.
Canadian Direct Investment in the United States
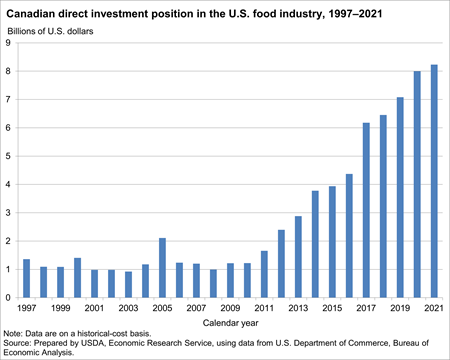
Canada is also an important source of FDI for the U.S. food industry. At the end of 2021, Canada's direct investment position in the U.S. food industry was more than $8.2 billion on a historical cost basis, which makes Canada the second largest foreign investor in the U.S. food industry (after the European Union), based on data for those countries whose observations are not suppressed. Between 2017 and 2021, Canada’s direct investment position in the U.S. food industry grew at a compound annual rate of 7.4 percent.
Download chart data in Excel format