Key Statistics & Graphics
This page provides the following information:
- Food Security Status of U.S. Households in 2022
- Food Security Status of U.S. Households with Children in 2022
- How Many People Lived in Food-Insecure Households?
- Food Insecurity by Household Characteristics
- Very Low Food Security by Household Characteristics
- Trends in Prevalence Rates
- State-Level Prevalence of Food Insecurity (map)
Food Security Status of U.S. Households in 2022
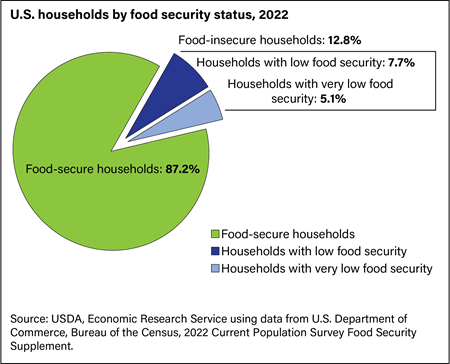
Food secure—These households had access, at all times, to enough food for an active, healthy life for all household members.
- 87.2 percent (115.8 million) of U.S. households were food secure throughout 2022.
- The 2022 prevalence of food security was statistically significantly lower than the 89.8 percent (118.5 million) in 2021.
Download chart data in Excel format.
Food insecure—At times during the year, these households were uncertain of having or unable to acquire enough food to meet the needs of all their members because they had insufficient money or other resources for food. Food-insecure households include those with low food security and very low food security.
- 12.8 percent (17.0 million) of U.S. households were food insecure at some time during 2022.
- The 2022 prevalence of food insecurity was statistically significantly higher than the 10.2 percent (13.5 million) in 2021.
Low food security—These food-insecure households obtained enough food to avoid substantially disrupting their eating patterns or reducing food intake by using a variety of coping strategies, such as eating less varied diets, participating in Federal food assistance programs, or getting food from community food pantries.
- 7.7 percent (10.2 million) of U.S. households had low food security in 2022.
- The 2022 prevalence of low food security was statistically significantly higher than 6.4 percent (8.4 million) in 2021.
Very low food security—In these food-insecure households, normal eating patterns of one or more household members were disrupted and food intake was reduced at times during the year because they had insufficient money or other resources for food.
- 5.1 percent (6.8 million) of U.S. households had very low food security at some time during 2022.
- The 2022 prevalence of very low food security was statistically significantly higher than the 3.8 percent (5.1 million) in 2021.
Food Security Status of U.S. Households with Children in 2022
Among U.S. households with children under age 18:
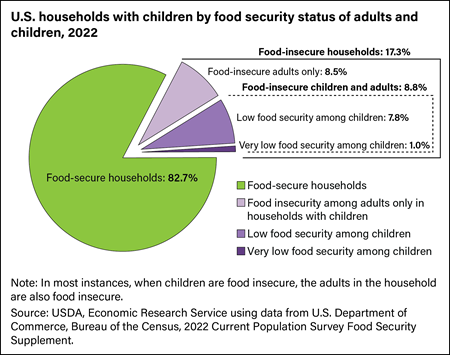
- 82.7 percent (30.8 million) of households with children were food secure in 2022.
- Household food insecurity affected 17.3 percent (6.4 million) of households with children in 2022. In some of these food-insecure households only adults were food insecure, while in other households children also experienced food insecurity.
- In 8.5 percent (3.2 million) of households with children, only adults were food insecure.
- Both children and adults were food insecure in 8.8 percent of households with children (3.3 million households).
- Children are usually protected from substantial reductions in food intake even in households with very low food security. Nevertheless, in about 1.0 percent of households with children (381,000 households), one or more child also experienced reduced food intake and disrupted eating patterns at some time during the year.
Download chart data in Excel format.
For more information, see the USDA, ERS report:
Food Insecurity in Households With Children: Prevalence, Severity, and Household Characteristics, 2010-11How Many People Lived in Food-insecure Households?
In 2022:
- 44.2 million people lived in food-insecure households.
- 11.7 million adults lived in households with very low food security.
- 7.3 million children lived in food-insecure households in which children, along with adults, were food insecure.
- 783,000 children (1.1 percent of the Nation's children) lived in households in which one or more child experienced very low food security.
For more information, see Food Insecurity in the U.S.: Frequency of Food Insecurity.
Food Insecurity by Household Characteristics
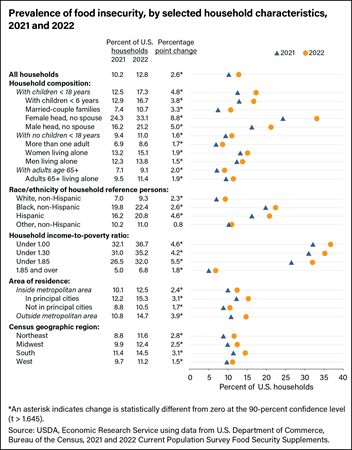
The prevalence of household food insecurity in 2022 was statistically higher than the prevalence in 2021 for all household types except households headed by Other, non-Hispanic reference persons. The figure below displays household prevalence rates of the percent of food-insecure households for both years, as well as percentage point changes between 2021 and 2022. An asterisk (*) next to the percentage point change indicates that the change was statistically significant. For example, 12.5 percent of households with children were food-insecure in 2021 and 17.3 percent of households with children were food insecure in 2022. That 4.8 percentage point change was statistically significant.
Download chart data in Excel format
For interactive data visualizations, see Interactive Charts and Highlights.
Very Low Food Security by Household Characteristics
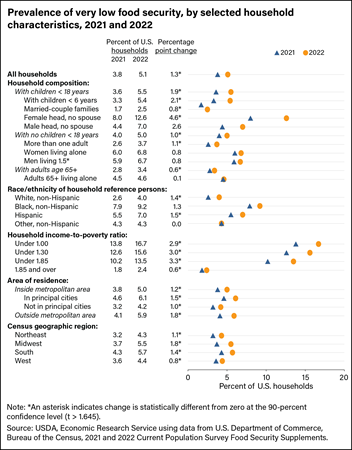
From 2021 to 2022, the prevalence of very low food security increased statistically significantly for most population subgroups. There were no statistically significant declines in the prevalence of very low food security from 2021 to 2022. The figure below displays prevalence rates of very low food security for both years, as well as percentage point changes between 2021 and 2022, with asterisks (*) indicating statistically significant changes between years. For example, as shown in the figure below, very low food security for households with children increased from 3.6 percent in 2021 to 5.5 percent in 2022, a statistically significant 1.9 percentage point change.
Download chart data in Excel format.
Trends in Prevalence Rates
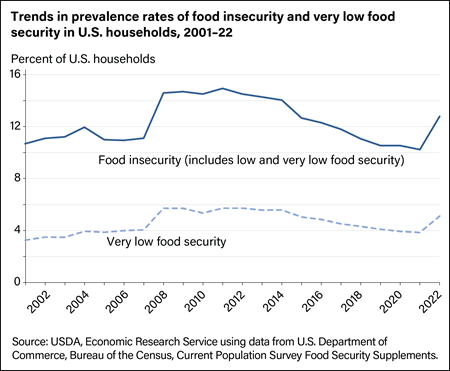
The 2022 prevalence of food insecurity (12.8 percent) was statistically significantly higher than the 2021 prevalence of 10.2 percent and significantly higher than the food insecurity prevalence observed from 2017 through 2020. Regarding earlier annual trends, a statistically significant decline in the prevalence of food insecurity from 11.1 percent in 2018 to 10.5 percent occurred in 2019 and food insecurity was unchanged at 10.5 percent in 2020. For the first time, in 2019, food insecurity was statistically significantly—at the 90 percent confidence level—below the 11.1 percent pre-recession level of 2007. Year-to-year declines in food insecurity from 2014–15, 2016‒17, and 2017–18 were also statistically significant. Some year-to-year changes were not statistically significant; that is, there was no real change, or the changes were within the range that could occur from sampling variation. The cumulative decline from 2011 (14.9 percent) to 2014 (14.0 percent) was statistically significant. In the previous decade, food insecurity increased from 10.7 percent in 2001 to 11.9 percent in 2004, declined to about 11 percent in 2005‒07, then increased significantly in 2008 (to 14.6 percent), and remained essentially unchanged (that is, the difference was not statistically significant) at that level in 2009 and 2010.
The prevalence of very low food security in 2022 (5.1 percent) was statistically significantly higher than the prevalence in 2021 (3.8 percent) and higher than the annual prevalence from 2017 through 2020. Statistically significant year-to-year declines in very low food security occurred from 2014–15 and 2016–17. The prevalence of very low food security was essentially unchanged from 2011 (5.7 percent) through 2014. The prevalence of very low food security was also 5.7 percent in 2008 and 2009. Before 2008, the prevalence of very low food security increased from 3.3 percent in 2001 to 3.9 percent in 2004 and remained essentially unchanged through 2007 (4.1 percent).
Download chart data in Excel format.
State-level Prevalence of Food Insecurity
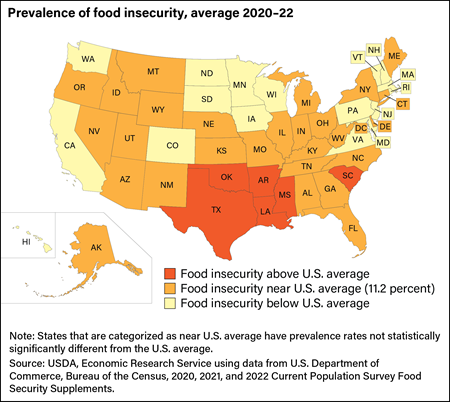
Prevalence rates of food insecurity varied considerably from State to State. Data for 3 years, 2020–2022, were combined to provide more reliable statistics at the State level. Estimated prevalence rates of food insecurity during this 3-year period ranged from 6.2 percent in New Hampshire to 16.6 percent in Arkansas; estimated prevalence rates of very low food security ranged from 2.1 percent in New Hampshire and North Dakota to 6.8 percent in South Carolina.
Download chart data in Excel format.
This section is based on the publication:
Household Food Security in the United States in 2022

