


Flexible Consumer Behavior Survey
Overview
Since 2007, USDA, Economic Research Service (ERS) has sponsored the Flexible Consumer Behavior Survey (FCBS)—a survey designed to collect information on U.S. consumers’ knowledge, attitudes, and beliefs about nutrition and food choices. The FCBS is a module of the National Health and Nutrition Examination Survey (NHANES) conducted by the National Center for Health Statistics (NCHS). NHANES collects diverse health data on U.S. consumers by administering household interviews and conducting physical examinations at mobile checkup centers. During the physical examination, NHANES also administers a dietary recall survey to gather information about the foods and beverages respondents consumed over the past 24 hours, making it possible to link dietary habits to health measures such as obesity, diabetes, and hypertension. Because NHANES covers a nationally representative sample of people living in the United States, FCBS data reflect national trends about changing dietary behaviors of U.S. consumers.
Data from the first (2007–2008), second (2009–2010), third (2011–2012), fourth (2013–2014), fifth (2015–2016), and sixth (2017–2018) waves of the FCBS are available for public use. The seventh wave (2019–2020) is limited due to early cessation of NHANES data collection in March 2020 that was caused by the onset of the Coronavirus (COVID-19) pandemic. Of the 30 NHANES primary sampling units (PSUs) planned for 2019–2020, only 18 were visited in 2019–March 2020. The 18 PSUs visited in 2019–March 2020 are not nationally representative, so NCHS combined the 2019–March 2020 NHANES with the 2017–2018 NHANES to create a nationally representative 2017–March 2020 pre-pandemic data set. More information on the construction of the 2017–March 2020 pre-pandemic data can be found on NCHS’s website.
The FCBS collects a range of information, including the following:
- Economic measures, such as monthly income, assets, food expenditures, as well as participation in food and nutrition assistance programs, like the Supplemental Nutrition Assistance Program (SNAP) and the Special Supplemental Nutrition Program for Women, Infants, and Children (WIC).
- Dietary and behavioral indicators, such as self-assessed diet quality; types of foods available in the home; frequency of eating out; time spent grocery shopping and cooking meals at home; nutritional knowledge; use of food labels while grocery shopping; use of nutrition information when eating out; and the importance of price, convenience, and taste when grocery shopping or eating out.
The 2005–2006 NHANES wave contained a preliminary wave of a subset of questions from the FCBS. Data from the FCBS are publicly available on NCHS's website. See the questions respondents answered by each FCBS wave:
- See the NHANES 2007–2008 Flexible Consumer Behavior Survey questionnaire.
- See the NHANES 2009–2010 Flexible Consumer Behavior Survey questionnaire.
- See the NHANES 2011–2012 Flexible Consumer Behavior Survey questionnaire.
- See the NHANES 2013–2014 Flexible Consumer Behavior Survey questionnaire.
- See the NHANES 2015–2016 Flexible Consumer Behavior Survey questionnaire.
- See the NHANES 2017–2018 Flexible Consumer Behavior Survey questionnaire.
- See the NHANES 2019–2020 Flexible Consumer Behavior Survey questionnaire.
- See the NHANES August 2021–August 2023 Flexible Consumer Behavior Survey questionnaire.
For more information about NHANES and data releases see: National Center for Health Statistics.
Selected Results From the 2017–March 2020 FCBS and Earlier Waves
USDA, ERS analysis of FCBS data provides insights into the use of nutrition information in stores and restaurants, frequency of eating out, consumption of convenience foods, self-assessed diet quality, and awareness of the MyPlate eating plan. The analysis focuses on adults aged 20 and older (“adults” hereafter), comparing 2017–March 2020 FCBS data with data from previous FCBS waves in the following six categories:
- Use of the Nutrition Facts panel on packaged food labels
- Use of nutrition information in restaurants
- Food-away-from-home meal frequency
- Consumption of convenience foods
- Self-assessed diet quality
- Awareness of the MyPlate eating plan
Use of the Nutrition Facts panel on packaged food labels
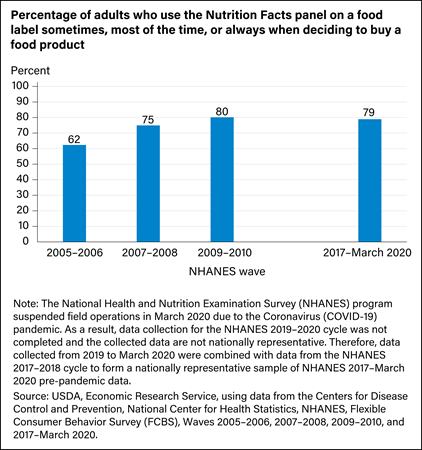
After the Nutrition Labeling and Education Act of 1990 (NLEA), people living in the United States had access to standardized nutrition information on almost all packaged foods sold in grocery stores, supermarkets, superstores, and other retail stores. For instance, the Nutrition Facts panel of all food labels lists the amount of calories, fat, fiber, carbohydrates, and some other nutritional information. Prior USDA, ERS research found that the percentage of adults reporting that they use the Nutrition Facts panel when deciding to buy a food product “sometimes,” “most of the time,” or “always” (i.e., regularly use it) declined in the decade immediately following implementation of the NLEA. See:
The Decline in Consumer Use of Food Nutrition Labels, 1995-2006By contrast, there has been an increasing trend in regular use of the Nutrition Facts panel since 2007–2008. FCBS data indicate that at least 3 out of 4 adults report that they used the Nutrition Facts panel regularly when deciding to buy a food product. For instance, in the most recent wave of FCBS data (2017–March 2020), nearly 4 out of 5 adults (79 percent) reported they regularly used the Nutrition Facts panel. This is significantly higher than the percentage of adults who reported regular use of the Nutrition Facts panel in 2005–2006 (62 percent).
View the exact wording of the FCBS question(s) and underlying data in Excel format.
Use of nutrition information in restaurants
USDA, ERS research indicates that food prepared away from home (FAFH) has become increasingly integral to the U.S. diet. The share of U.S. consumers’ food budgets for FAFH surpassed the share for food at home (FAH) for the first time in 2010 when it was slightly over 50 percent, up from 41 percent in 1984. See:
America’s Eating Habits: Food Away From HomeThe share of calories from FAFH has also increased over time. Since 2011, FAFH has accounted for more than 30 percent of total food energy intake. See:
Dietary Quality by Food Source and Demographics in the United States, 1977–2018There are important implications of higher FAFH consumption for the U.S. diet. USDA, ERS research indicates that, among adults, substituting an FAFH meal for a meal prepared at home adds about 134 calories to an individual's daily caloric intake and lowers diet quality by about 2 points on the Healthy Eating Index. See:
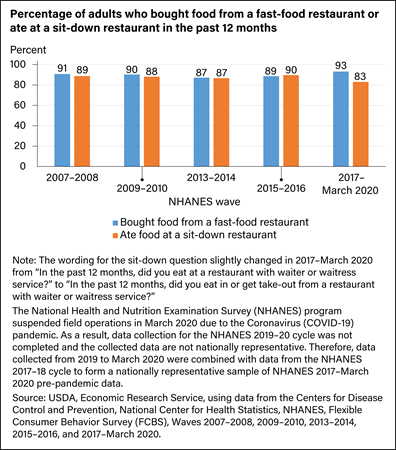
The Impact of Food Away From Home on Adult Diet QualityFCBS data show that the vast majority of adults reported that, in the past 12 months, they bought food from a fast-food or pizza place (“fast-food restaurant”) or had eaten at a restaurant with wait service (“sit-down restaurant”). In 2017–March 2020, about 93 percent of adults bought food from a fast-food restaurant, and 83 percent of adults ate in or got take-out from a sit-down restaurant in the past 12 months.
View the exact wording of the FCBS question(s) and underlying data in Excel format.
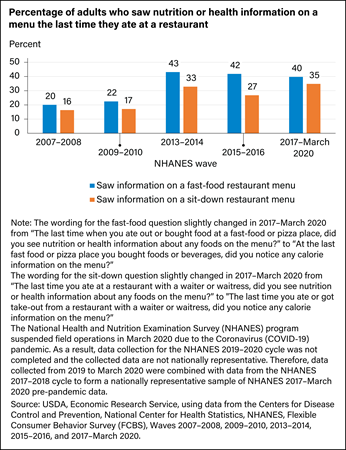
Among respondents who had either purchased food from a fast-food restaurant or eaten food at a sit-down restaurant in the past 12 months, the FCBS asked if they saw nutrition information about any foods on the menu during their last visit. The percentage of adults who saw nutrition information on a fast-food restaurant menu increased significantly from 20 percent in 2007–2008 to 40 percent in 2017–March 2020. Over the same time period, the percentage of adults who saw nutrition information on a sit-down restaurant menu increased significantly from 16 percent to 35 percent. These increases are likely driven by local and State restaurant menu labeling regulations that were implemented starting in 2007, national restaurant menu labeling regulations that were implemented in May 2018, and voluntary efforts to improve access to nutrition information at the point of purchase by a growing share of foodservice establishments throughout the nation.
View the exact wording of the FCBS question(s) and underlying data in Excel format.
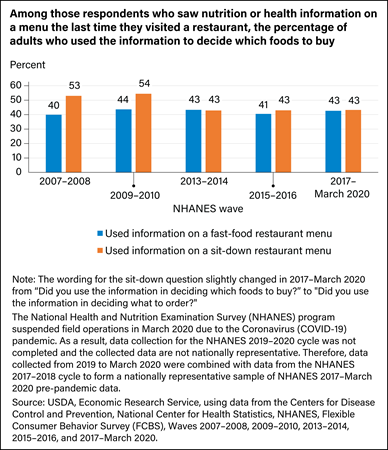
For those who saw nutrition information about any foods on a fast-food or sit-down restaurant menu during their last restaurant visit, the FCBS also asked respondents if they used the information in deciding which foods to buy. From 2007–2008 to 2017–March 2020, the percentage of adults who used nutrition information on a fast-food restaurant menu rose by an insignificant amount, from 40 percent to 43 percent. In contrast, over the same period, the percentage of adults who used nutrition information on a sit-down restaurant menu dropped significantly by 10 percentage points—from 53 percent to 43 percent.
View the exact wording of the FCBS question(s) and underlying data in Excel format.
USDA, ERS research suggests that when seeing nutrition information on restaurant menus, some consumers may use the information to align their food orders with their demand for lower calories, helping them keep their total daily caloric intake lower than consumers who see but do not use the information. Using FCBS data from 2007–2008 through 2013–2014, USDA, ERS researchers compared the average total daily calorie intakes of adults who saw nutrition information on a menu on their last restaurant visit and then used the information (when ordering) to a comparable group of adults who noticed the information but chose not to use it. Because these two groups may differ in other ways, USDA, ERS researchers also adjusted caloric intakes for differences in socio-demographic characteristics and interview-related factors (such as whether consumption occurred on a weekday or weekend). Even after accounting for such differences, the analysis revealed that restaurant menu label users consumed 167–180 fewer calories per day compared with nonusers—a calorie intake gap of 8–9 percent of a 2,000-calorie reference diet. See:
The Association Between Restaurant Menu Label Use and Caloric IntakeFood-away-from-home meal frequency
To get a sense of how often consumers eat out, the FCBS collects information on how many FAFH meals respondents had consumed in the past 7 days. In 2007–2008, adults reported, on average, that they had consumed 4.0 FAFH meals in the past 7 days. In 2017–March 2020, average FAFH meal frequency fell to 3.7 FAFH meals in the past 7 days, though the change from 2007–2008 was not significant.
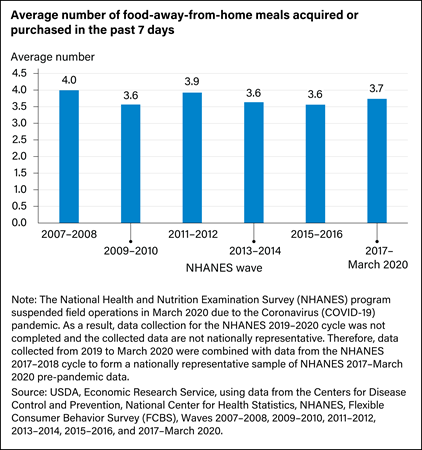
View the exact wording of the FCBS question(s) and underlying data in Excel format.
USDA, ERS research, using the 2007–2008 and 2009–2010 waves of the FCBS, found that, of the adults who eat out, those who eat out more frequently are less likely to use nutrition information at fast-food and sit-down restaurants than those who eat out occasionally. This result suggests that consumers who frequently eat at restaurants are more familiar with the nutrition information on menus and are less likely to use it, or they may be less inclined to eat a healthy diet. See:
Consumers' Use of Nutrition Information When Eating OutConsumption of convenience foods
Preparing food at home can be time-intensive. Owing to time constraints caused by work and family responsibilities, consumers may instead choose to purchase frozen meals or "ready-to-eat" foods such as salads, soups, chicken, sandwiches, and cooked vegetables from the salad bars and deli counters of grocery stores. The FCBS collects information about the consumption of convenience foods in the past 30 days. In 2007–2008, adult respondents reported that, on average, in the past 30 days, they had consumed ready-to-eat foods 1.9 times and frozen meals or pizzas 2.7 times. In 2017–March 2020, while average consumption of ready-to-eat foods increased significantly to 2.2 times, average consumption of frozen meals or pizzas significantly fell to 2.4 times.
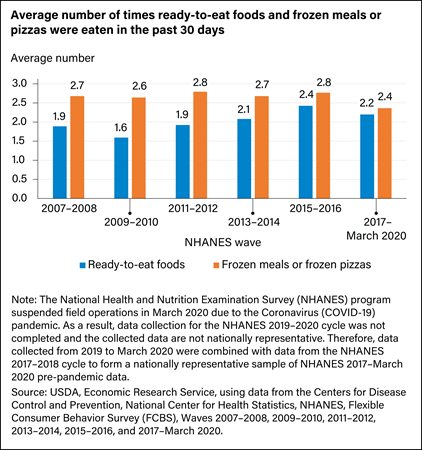
View the exact wording of the FCBS question(s) and underlying data in Excel format.
ERS research indicates that over the last 4 decades, the demand for convenience foods has grown in the U.S. This increased demand for convenience foods may have important implications for diet quality and health. See:
U.S. Households’ Demand for Convenience FoodsSelf-assessed diet quality
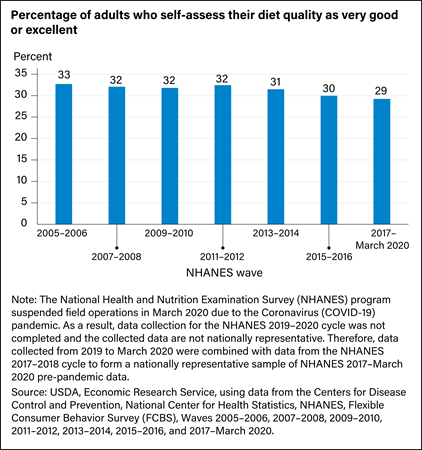
The FCBS helps in evaluating how people in the U.S. assess their own diets by asking respondents if they think their diets are “poor,” “fair,” “good,” “very good,” or “excellent” in terms of healthfulness. In 2017–March 2020, just under 3 in 10 adults reported that the healthfulness of their diet was “very good” or “excellent,” which is significantly lower by 4 percentage points than the corresponding share in 2005–2006 (about 1 in 3 adults).
View the exact wording of the FCBS question(s) and underlying data in Excel format.
USDA, ERS research found that 41 percent of adults surveyed in the 1989–1991 Continuing Survey of Food Intakes of Individuals rated their diets as “very good” or “excellent,” in terms of healthfulness. This percentage later fell to 32 percent, according to pooled data from the 2005–2006 and 2007–2008 FCBS. This pattern was observed even though objective measures of the U.S. diet underwent little change between 1989–1991 and 2005–2008, which may suggest shifts toward more realistic self-assessments of diet quality. See:
How Americans Rate Their Diet Quality: An Increasingly Realistic PerspectiveAwareness of the MyPlate eating plan
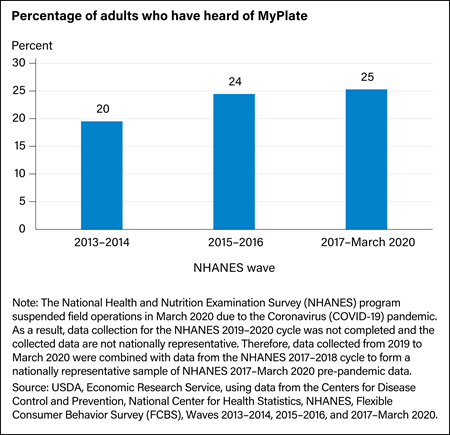
A USDA guide to support healthy eating patterns called MyPlate, based on the Dietary Guidelines for Americans, replaced MyPyramid and the Food Guide Pyramid in June 2011. The MyPlate plan is a personalized eating plan that recommends food group targets based on an individual’s age, sex, height, weight, and physical activity level. The FCBS data indicate that 1 out of 4 adults reported hearing of MyPlate in 2017–March 2020, up significantly from 1 out of 5 adults in 2013–2014.
View the exact wording of the FCBS question(s) and underlying data in Excel format.
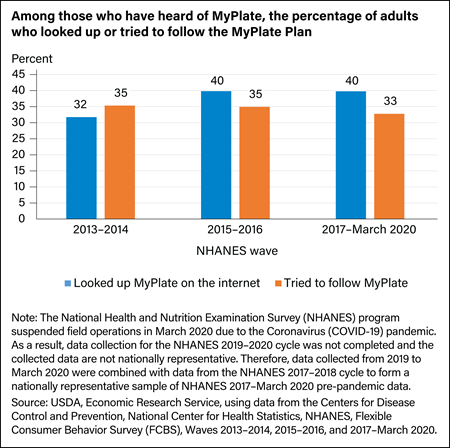
Among those who had heard of MyPlate, the FCBS asked respondents if they had looked up or tried to follow recommendations in the MyPlate plan. From 2013–2014 to 2017–March 2020, the percentage of adults who looked up the MyPlate plan on the internet rose significantly from 32 percent to 40 percent. In contrast, the percentage of adults who had tried to follow the recommendations in the MyPlate plan did not significantly change from 35 percent in 2013–2014 to 33 percent in 2017–March 2020.
View the exact wording of the FCBS question(s) and underlying data in Excel format.