


Oil Crops Sector at a Glance
- U.S. Soy Production
- U.S. Policy on Soybeans and Oil Crops
- Major Foreign Soybean Products Exporters and Importers
U.S. Soy Production
The major U.S. oilseed crops are soybeans, cottonseed, sunflower seed, canola, rapeseed, and peanuts. Soybeans are the dominant oilseed in the United States, accounting for about 90 percent of U.S. oilseed production. Most U.S. soybeans are planted in May and early June and harvested in late September and October (for more information about soybean plating dates by region, see Usual Planting and Harvesting Dates for U.S. Field Crops).
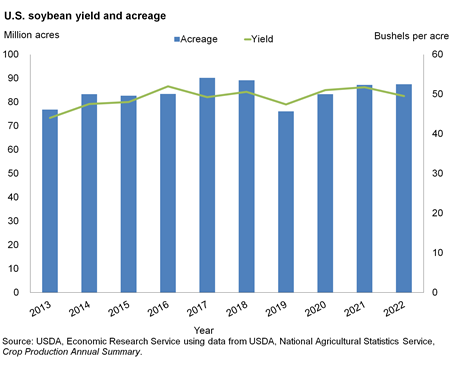
Large-scale production of soybeans did not begin until the 20th century in the United States, but since then area planted to soybeans has expanded rapidly. Increased planting flexibility, yield improvements from narrow-rowed seeding practices, a greater number of 50-50 corn-soybean rotations, and low production costs (partly due to widespread adoption of herbicide-tolerant varieties) favored the expansion of soybean acreage. More than 90 million acres of soybeans were planted in 2017, and in 2018 planted acres of soybeans in the United States (89.2 million acres) exceeded corn acres for the first time since 1983. Soybean acres decreased to 87.45 million acres in 2022.
Acreage tends to be concentrated where soybean yields are highest (for historical data on soybean and other oil crop acreage, yields, and prices, see the Oilseed Crop Yearbook). Higher yields reduce per-bushel production costs, increasing profitability. Midwestern soybean producers generally have higher yields and lower per-acre cash costs than Southern and Eastern producers. More than 80 percent of U.S. soybean acreage in 2022 is concentrated in the Midwest, although significant amounts are still planted in the historically important areas of the Delta and Mid-Atlantic regions. In 2022, the top soybean producing States were Illinois, Iowa, and Minnesota, accounting for more than 38 percent of total U.S. production.
Data from the 2017 Census of Agriculture indicated that 303,191 U.S. farms raised soybeans for beans in 2017, marginally up from 2012. Average harvested soybean acreage increased from 114 acres per farm in 1978 to 297 acres per farm in 2017. Although small farms with fewer than 250 acres accounted for 67 percent of the farms growing soybeans, these farms produced less than 19 percent of the 2017 crop. Irrigation was used on nearly 9.4 million acres, or 10 percent of U.S. soybean acreage in 2017.
Download chart data in Excel format
Over the last couple of decades, an increasing number of soybean farmers have adopted conservation tillage practices. The development of better herbicide applications has allowed producers to use less intensive soil cultivation practices. Soybean pesticide use—nearly all of which are herbicides—ranks second only to corn. Commercial fertilizer was applied to less than 40 percent of soybean acreage, a much lower rate than for most row crops (e.g., corn and cotton). Unlike other crops, soybeans can balance their own nitrogen and require minimal nitrogen fertilizer (for more information, see the Crop Production Practices database from the Agricultural Resource Management Survey).
Soybeans were one of the first bioengineered crops to achieve commercial success. Since 2014 the U.S. Department of Agriculture (USDA) has conducted a farm survey to determine the extent that biotech crops have been adopted (for more information, see the annual Acreage report by USDA’s National Agricultural Statistics Service). Biotech soybeans are nearly all herbicide resistant, and at least 94 percent of U.S. soybean acreage has been reported as herbicide resistant since 2014. The popularity of bioengineered soybeans among U.S. farmers has ramifications for resource use, marketing, and international trade. Herbicide-tolerant soybeans have lowered the cost and changed the type of herbicides used by farmers (for more information see The Economics of Glyphosate Resistance Management in Corn and Soybean Production report). Despite potentially higher returns, the adoption of organic field crop production, including soybeans, has been slow and is challenging due to factors such as achieving effective weed control and the processes involved with organic certification. The genetically modified herbicide-tolerant seed used extensively in conventional production is prohibited in organic production.
U.S. Policy on Soybeans and Oil Crops
Oilseeds are covered under Title I—Crop Commodity Programs (for more information, Crop Commodity Programs) of the 2018 Farm Act. The USDA’s Farm Service Agency (FSA) delivers Title I commodity support programs that include the Price Loss Coverage (PLC), the Agriculture Risk Coverage (ARC), and the Nonrecourse Marketing Assistance Loan Program (MAL). Eligibility for commodity program support can include (but is not limited to) meeting adjusted gross income limitations, complying with conservation and wetland protection requirements, and verifying the level of participation in farming activities. Once individuals are eligible, payment limitations cap the total amount they can receive. The 2018 farm bill extended authority for most current commodity programs with some modifications to the ARC, PLC, and MAL programs.
Under the 2018 Farm Act, producers were allowed a one-time choice between ARC and PLC on a commodity-by-commodity basis, with payments made on 85 percent of each commodity’s base acres (i.e., historical program acres that are eligible for ARC and PLC payments). To increase producer flexibility, the 2018 Farm Act provided producers the option of switching between ARC and PLC coverage in 2019, on a commodity-by-commodity basis, effective for both crop years 2019 and 2020. Producers then have the option to change their program elections (between ARC and PLC) annually, beginning in crop year 2021. Producers also have the option to sign a multiyear contract for the ARC and PLC programs. If no initial choice is made, the producer will not receive any support in 2019, and the program defaults to whichever program was in effect under the 2014 Farm Act.
Price Loss Coverage (PLC): Producers who hold base acres of oilseeds, peanuts, wheat, feed grains, rice, seed cotton, and pulses (covered commodities) are eligible to enroll in the PLC program on a commodity-by-commodity basis. Under the 2018 Farm Act, payments were made when a commodity’s effective price (the greater of the commodity’s marketing year average price or its Nonrecourse Marketing Assistance Loan rate) falls below the legislatively determined reference prices. As outlined in the 2018 Farm Act, the reference prices for oilseeds crops for 2018–21 are:
- Soybeans: $8.40 per bushel
- Other oilseeds: $20.15 per hundredweight
- Peanuts: $535.00 per ton
The 2018 Farm Act changed the reference price to an “effective reference price” that is allowed to move over time, depending on market conditions. Additionally, the 2018 Farm Act offered producers a one-time opportunity to update their PLC payment yields that took effect beginning with the 2020 crop year. Any year during 2019–22 for which the farm-level yield falls below 75 percent of the average county yield is assigned 75 percent of the 2019–22 average county yield.
- Agriculture Risk Coverage (ARC): The 2018 Farm Bill continued the law as established by the 2014 Farm Bill. However, the effective reference price is also used in ARC payment calculations. Producers who hold base acres of oilseeds, peanuts, wheat, feed grains, rice, seed cotton, and pulses (covered commodities) are eligible to enroll in ARC on a county or individual farm basis. County ARC payments are made when county crop revenue for the enrolled commodity drops below 86 percent of the county benchmark revenue. Individual ARC payments are made when the actual individual crop revenues, summed across all covered commodities on the ARC farm, are less than 86 percent of the ARC individual benchmark revenue.
- Moreover, the 2018 Farm Act further updated the ARC calculation by including a trend adjustment for both the average historical county yield and the actual average county yield per planted acre. This trend adjustment cannot exceed the trend-adjusted yield factor that is used to increase yield history under the Federal Crop Insurance Act for that crop and county. Moreover, the 2018 Farm Act required the floor of permissible annual yield values, known as the yield plug, to rise from 70 percent of transitional yields (yields used for crop insurance policies that are based on county average yields and are typically used in lieu of actual yields for producers who do not have sufficient eligible historical yields) to 80 percent.
- Marketing Assistance Loan (MAL) Program: A post-harvest nonrecourse commodity loan program with marketing loan provisions for producers of wheat, corn, grain sorghum, barley, oats, upland cotton, extra-long staple (ELS) cotton, long- and medium-grain rice, soybeans, other oilseeds, peanuts, wool, mohair, honey, dry peas, lentils, and small and large chickpeas. MAL offers producers short-term loans during harvest time when market prices tend to be lowest, allowing them to delay the sale of the commodity until market conditions improve. When market prices fall below loan rates (the price per unit—pound, bushel, bale, or hundredweight—at which the Commodity Credit Corporation (CCC) provides commodity-secured loans to farmers for a specified period of time), marketing loan provisions allow for repayment of loans at the lower price and for loan deficiency payments to producers who choose not to place commodities under loan. The 2018 Farm Act updated the national average loan rates for oilseeds:
- Soybeans: $6.20 per bushel
- Other oilseeds: $10.09 per hundredweight
- Peanuts: $355.00 per ton
Export and Food Aid Programs
Export programs administered by USDA's Foreign Agricultural Service (FAS) and the U.S. Agency for International Development (USAID) help promote and facilitate purchase of U.S. agricultural products in foreign markets. The 2018 Farm Bill consolidates USDA’s four market development and export promotion programs-the Market Access Program (MAP), the Foreign Market Development Program (FMDP), the Emerging Markets Program (EMP), and Technical Assistance for Specialty Crops (TASC)-into a new Agricultural Trade Promotion and Facilitation Program and provides the Secretary of Agriculture new flexibility in promoting trade (for more see 2018 Farm Bill, Trade: Title III). Other programs include the Export Credit Guarantee Program (GSM-102), which the 2018 Farm bill funds through fiscal year (FY) 2023, and the Priority Trade Fund.
- Export credit guarantees help foreign importers facing foreign exchange constraints and needing credit to purchase commodities. The Export Credit Guarantee Program underwrites commercial financing of U.S. agricultural exports by guaranteeing repayment of private, short-term credit for up to 24 months. CCC does not provide financing, but guarantees payments due from foreign banks, which allows U.S. financial institutions to offer competitive credit terms to foreign banks.
- The Market Access Program (MAP) aids in the creation, expansion, and maintenance of foreign markets for U.S. agricultural products. MAP forms partnerships between CCC and nonprofit trade associations, cooperatives, trade groups, or small businesses to share the cost of overseas marketing and promotional activities. MAP partially reimburses program participants for these activities, which include consumer promotions, market research, trade shows, and trade servicing.
- The Foreign Market Development Program, also known as the Cooperator Program, aids in the creation, expansion, and maintenance of long-term export markets for U.S. agricultural products. The program enlists private-sector involvement and resources in coordinated efforts to promote U.S. products to foreign importers and consumers around the world. CCC funds are used to partially reimburse cooperators conducting approved overseas promotion activities.
Environment and Conservation Programs
The 2018 Farm Bill continued support for conservation practices on agricultural land with some changes (for more information see Conservation Programs). Farmers cropping highly erodible land are required to implement an approved conservation plan and to be compliant with wetland conservation provisions to remain eligible for nearly all agriculture-related farm program benefits, including farm commodity programs, crop insurance premium subsidies, conservation programs such as the Conservation Reserve Program (CRP), Conservation Stewardship Program (CSP), the Environmental Quality Incentives Program (EQIP), Agricultural Conservation Easement Program (ACEP), Regional Conservation Partnership Program (RCPP), disaster assistance, farm loan programs, and other benefits. Producers who choose to till native sod that has not been previously tilled are penalized and receive reduced crop insurance premium subsidies and limits on the yield or revenue guarantee available in not more than 4 cumulative years during the first 10 years after initial tillage (CRS-78).
International Trade
World oilseed trade consists of many closely substitutable commodities, such as soybeans, rapeseed, sunflowerseed, and cottonseed. Countries also trade oils and meals obtained from crushing oilseeds. Soybeans are the fourth leading crop produced globally, by volume. Although some of the crop is used directly, more than 80 percent of the crop is processed into soybean meal and oil through crushing. Divergent demand for protein meal and vegetable oil, as well as limits on domestic processing capacity, determine the ratio of oilseeds to oilseed products that countries import. The volume and source of foreign imports depend on seasonal availability and relative prices, credit and delivery terms, local preferences, and quality (for more information, see Major Factors Affecting Global Soybean and Products Trade Projections). Combined, soybeans and their derivatives are the most traded agricultural commodity. In 2020/21 they accounted for nearly 10 percent of the total value of global agricultural trade. Global trade of soybeans and soybean products has risen rapidly since the early 1990s and, by 2008/09, surpassed global trade of wheat and total coarse grains. USDA, FAS’s monthly report Oilseeds: World Markets and Trade presents forecasts and historical data by country for the major oilseeds and their products, covering production, domestic consumption, and international trade.
U.S. Exports and Imports
The United States is the world's second largest soybean producer after Brazil. Oilseed and oilseed product exports, particularly soybeans, represent a significant source of demand for U.S. producers and make a large net contribution to the U.S. agricultural trade balance. Among all U.S. agricultural products, only grains and feeds outrank the oilseed sector in total export value and volume. In the early 2000s, the value of U.S. oilseed and product exports averaged more than $9 billion, nearly half the farm-level value of production. By fiscal year (FY) 2021, the value of soybean exports alone had increased to more than $26.4 billion. USDA, Economic Research Service's Outlook for U.S. Agricultural Trade provides the latest information on U.S. farm exports by commodity and region, as well as the trade outlook. USDA, FAS tracks current U.S. export sales of soybeans, soybean meal, and soybean oil by destination on a weekly basis.
The main export destinations for U.S. oilseeds, oilseed meal, and vegetable oil include China, the European Union (EU), Japan, Mexico, and Taiwan. Other important markets include Indonesia, South Korea, and Thailand. Canada, Mexico, the Philippines, and several Latin American countries also import significant quantities of U.S. oilseed meals. U.S. vegetable oil exports are more dispersed and are heavily influenced by concessional food aid to developing nations through such programs as P.L. 480. However, rising domestic demand for soybean oil—particularly for biofuel production—may impact the U.S. export program.
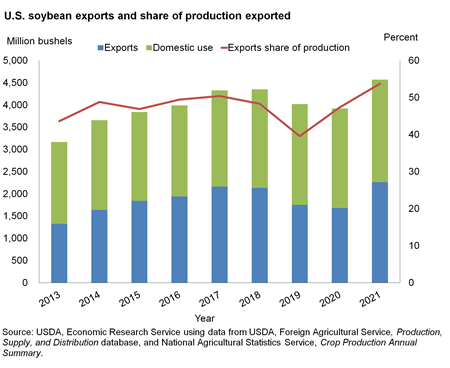
U.S. Soybean Exports and Share of Production
Download chart data in Excel format
The United States is a relatively small importer of oilseeds and oilseed products. Imports for marketing year (MY) 2020/2021 (beginning October 1 and ending September 30 of the latter year) had risen to over $14 billion, nearly 60 percent higher than 10 years earlier. These imports are mainly rapeseed and rapeseed products (e.g., canola oil) from Canada, olive oil from Western Europe, and tropical oils from the Philippines, Indonesia, and Malaysia.
Major Foreign Soybean Products Exporters and Importers
The primary factors impacting global soybean and products trade include population and income growth, which are driving the world’s increasing demand for livestock products, as well as policies implemented by major agricultural importers and exporters. Despite substantial growth in oilseed and oilseed product output in the past 25 years and recent gains in export volume, the U.S. share of global exports has steadily diminished. In the mid- to late-1970s, the United States dominated world trade in unprocessed oilseeds, with a global market share of more than 70 percent. Recently, this figure has fallen below 40 percent. In 2021, the United States share of soybean exports accounted for 38 percent of global soybean trade (for more information, see World Supply and Use of Oilseeds and Oilseed Products).This percentage is likely to fluctuate on increasing competition from South America. Continued expansion of area in Brazil with increases in production and marketing chain infrastructure are the primary cause of declining U.S. market share in China in the recent years. From a smaller percentage base, the United States had seen its share of oilseed meal and vegetable oil exports decline.
Meanwhile, there has been phenomenal growth in foreign soybean output and exports, particularly by Brazil. Brazil’s soybean production now exceeds U.S. soybean production, and Brazil currently shares more than half of the global soybean export market, up from less than 15 percent before 1980. With increased soybean production and rapid growth in crushing capacity, Brazil and Argentina have each surpassed the United States in soybean meal and soybean oil exports. As U.S renewable fuel policies continue to incentivize the use of soybean oil for biofuel production, stimulating soybean crush capacity expansions, domestic demand for soybean oil is expected to grow, impacting exports. Brazil’s soybean and soybean meal exports are projected to continue capturing some of the market share from the United States in the next decade (for more information, see Corn and Soybean Production Costs and Export Competitiveness in Argentina, Brazil, and the United States).