

Documentation
Overview
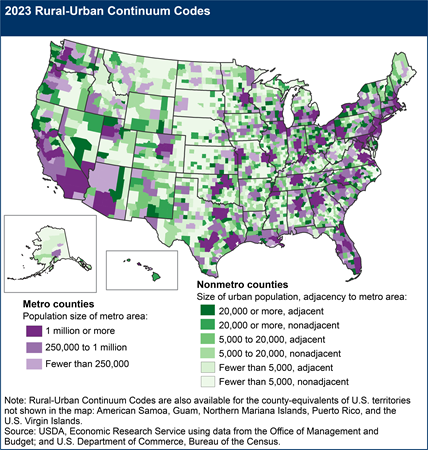
The 2023 Rural-Urban Continuum Codes distinguish U.S. metropolitan (metro) counties by the population size of their metro area, and nonmetropolitan (nonmetro) counties by their degree of urbanization and adjacency to a metro area. The division of counties as either metro or nonmetro, based on the 2023 Office of Management and Budget (OMB) delineation of metro areas, is further subdivided into three metro and six nonmetro categories. Each county and census-designated county-equivalent in the United States, including those in outlying territories, is assigned one of these nine codes. The codes allow researchers, policy makers, and others to view county-level data by finer residential groups—beyond metro and nonmetro—when analyzing trends related to population density and metro influence.
Scope/Coverage of Data
The 2023 Rural-Urban Continuum Codes classify 3,235 counties and census-designated county-equivalents in the United States, including those in Puerto Rico and other outlying territories. County-equivalents (often included in the term "county" for ease of description), include parishes in Louisiana, boroughs in Alaska, planning regions in Connecticut, independent cities in Virginia, municipios in Puerto Rico, and entities in other outlying territories. Nine Virginia independent cities were combined with their surrounding counties to determine their Rural-Urban Continuum Code. These counties and independent cities share the same code but are reported separately, resulting in the total number of entities in the 50 U.S. States and the District of Columbia being 3,144 (see the data file for details).
The Rural-Urban Continuum Codes were created in 1975 by Fred K. Hines, David L. Brown, and John M. Zimmer, then of the Economic Research Service, for their report, Social and Economic Characteristics of the Population in Metro and Nonmetro Counties, 1970. The codes have been updated after each decennial census since then (1983, 1993, 2003, 2013, 2023) with limited changes to the methods in 1983 and 2023 (described below). All five versions of the Rural-Urban Continuum Codes are in the file listing of this data product.
Methods
To create the 2023 Rural-Urban Continuum Codes, all U.S. counties and county-equivalents were first grouped according to their official metro-nonmetro status, defined by the Office of Management and Budget (OMB) as of June 2023. Metro areas are defined as broad labor-market areas that include central counties with one or more urban areas with populations of 50,000 or more people. They also include outlying counties that are economically tied to the core counties as measured by labor-force commuting. OMB determined current metro status using population and worker commuting criteria from the 2020 Census and the 2016–20 American Community Survey (ACS). A description of metro area criteria is available in this OMB bulletin.
For Rural-Urban Continuum Codes 1-3, metro counties were divided into three categories according to the total population of the metro area of which they are part: 1 million people or more (code 1), 250,000 to 1 million people (code 2), and below 250,000 (code 3). Note that all counties in a given metro area are classified according to the metro area population, not the county population. For example, despite having fewer than 4,500 residents, Calhoun County, Illinois is given a code of 1 because it is part of the St. Louis metro area.
Nonmetro counties are classified along two dimensions. First, they are divided into three urban-size categories: an urban population of 20,000 or more (codes 4 and 5), 5,000 to 20,000 (codes 6 and 7), and fewer than 5,000 (codes 8 and 9), based on the total urban population in the county. Urban areas are defined by the U.S. Census Bureau as densely developed areas with 2,000 or more housing units or 5,000 people. Urban areas do not necessarily follow municipal boundaries. They are essentially densely settled territory as it might appear viewed from the air. Most counties, whether metro or nonmetro, contain a combination of urban and rural populations. A description of urban area criteria is available in this Federal Register Notice.
Second, nonmetro counties in the three urban-size categories are sub-divided by whether or not the county is adjacent to one or more metro areas. A nonmetro county is defined as adjacent (codes 4, 6, and 8) if it physically adjoins one or more metro areas and has at least 2 percent of its employed labor force commuting to central metro counties. County-level commuting data come from the 2016–20 American Community Survey and represent average commuting levels during that 5-year period. Nonmetro counties that do not meet the adjacency criteria are classed as nonadjacent (codes 5, 7, and 9).
Continuity in methods benefits researchers using the Rural-Urban Continuum Codes to analyze trends over time. Only two changes were made to these criteria since 1974. First, the percent of labor force commuting used to establish adjacency was raised from 1 to 2 percent in 1983. Second, the lower threshold for urban area population was raised from 2,500 to 5,000 in 2023. As described in the Strengths and Limitations section, this second change reflected a change to the Census Bureau’s urban area criteria and resulted in a large shift in county classifications.
| Code | Description | |||||||
|---|---|---|---|---|---|---|---|---|
| Metro counties: | ||||||||
| 1 | Counties in metro areas of 1 million population or more | |||||||
| 2 | Counties in metro areas of 250,000 to 1 million population | |||||||
| 3 | Counties in metro areas of fewer than 250,000 population | |||||||
| Nonmetro counties: | ||||||||
| 4 | Urban population of 20,000 or more, adjacent to a metro area | |||||||
| 5 | Urban population of 20,000 or more, not adjacent to a metro area | |||||||
| 6 | Urban population of 5,000 to 20,000, adjacent to a metro area | |||||||
| 7 | Urban population of 5,000 to 20,000, not adjacent to a metro area | |||||||
| 8 | Urban population of fewer than 5,000, adjacent to a metro area | |||||||
| 9 | Urban population of fewer than 5,000, not adjacent to a metro area | |||||||
| Source: USDA, Economic Research Service using data from the Office of Management and Budget and U.S. Department of Commerce, Bureau of the Census. | ||||||||
All told, the 2023 Rural-Urban Continuum Codes include 1,186 metro counties and 1,958 nonmetro counties in U.S. States and the District of Columbia.
| Code | Number of counties | 2020 population | ||||||
|---|---|---|---|---|---|---|---|---|
| Metro | 1,186 | 285,649,622 | ||||||
| 1 | 443 | 189,022,706 | ||||||
| 2 | 385 | 67,394,427 | ||||||
| 3 | 358 | 29,232,489 | ||||||
| Nonmetro | 1,958 | 45,799,659 | ||||||
| 4 | 201 | 13,373,768 | ||||||
| 5 | 76 | 4,174,535 | ||||||
| 6 | 379 | 11,500,943 | ||||||
| 7 | 247 | 6,050,425 | ||||||
| 8 | 466 | 6,157,541 | ||||||
| 9 | 589 | 4,542,447 | ||||||
| U.S. total | 3,144 | 331,449,281 | ||||||
| Source: USDA, Economic Research Service using data from the Office of Management and Budget and U.S. Department of Commerce, Bureau of the Census. Population comes from the 2020 Census Demographic and Housing Characteristics File. | ||||||||
Additionally, the 2023 Rural-Urban Continuum Codes include 89 county equivalents located in outlying U.S. territories.
| Code | Number of counties | 2020 population | ||||||
|---|---|---|---|---|---|---|---|---|
| Metro | 66 | 3,078,488 | ||||||
| 1 | 40 | 2,081,265 | ||||||
| 2 | 13 | 532,245 | ||||||
| 3 | 13 | 464,978 | ||||||
| Nonmetro | 23 | 545,407 | ||||||
| 4 | 3 | 88,562 | ||||||
| 5 | 5 | 312,305 | ||||||
| 6 | 6 | 103,403 | ||||||
| 7 | 1 | 17,059 | ||||||
| 8 | 2 | 13,629 | ||||||
| 9 | 6 | 10,449 | ||||||
| U.S. total | 89 | 3,623,895 | ||||||
| Note: U.S. territories included here are American Samoa, Guam, Northern Mariana Islands, Puerto Rico, and the U.S. Virgin Islands. Two county equivalents in American Samoa were not classified because they reported zero population in 2020. Source: USDA, Economic Research Service using data from the Office of Management and Budget and U.S. Department of Commerce, Bureau of the Census. Population comes from the 2020 Census Demographic and Housing Characteristics File. |
||||||||
Strengths and Limitations
The Rural-Urban Continuum Codes are based on counties, which are a standard building block for publishing economic data and for conducting research to track and explain regional population and economic trends. Estimates of population, employment, and income are available annually. Changes to county geography are rare compared with other geographic units used by researchers, such as census tracts or ZIP Code areas. Building on the widely used metro-nonmetro dichotomy, the Rural-Urban Continuum Codes provide a more detailed residential classification for the analysis of trends related to degree of rurality and metro proximity.
For some research and policy applications, counties are too large to adequately capture the complexity of settlement patterns and labor market areas. This is especially true in western States. Many metro counties are large enough to include people who are legitimately nonmetro in terms of both population size and remoteness. Conversely, large nonmetro counties may contain a portion of population economically tied to metro areas as reflected in their commuting levels. The USDA, ERS Rural-Urban Commuting Area Codes, based on census tracts rather than counties, were developed in large part to address this limitation.
Although counties are more stable over time compared with other geographic units, changes to county boundaries do occur from time to time, which hampers longitudinal analysis. The largest such change occurred in 2022, when planning regions in Connecticut replaced counties in the Census Bureau’s county-level geography. To account for these changes, population figures for Connecticut’s planning regions were calculated using county subdivision data from the 2020 Decennial Census according to the Census Bureau’s County to County Subdivision Crosswalk file. Details and timing of county changes since 1970 can be found in this technical description of Substantial Changes to Counties and County Equivalent Entities: 1970-Present on the U.S. Census Bureau website.
As described above, only two changes were made to the criteria used to delineate the Rural-Urban Continuum Codes, providing some helpful continuity for research looking at trends over time. However, changes to criteria used by OMB to define metro areas and by the U.S. Census Bureau to define urban areas have affected the delineation of Rural-Urban Continuum Codes over the past five decades. Between 2003 and 2013, the data source for daily commuting switched from the decennial census (measuring one point in time during 2000) to the American Community Survey (providing a 5-year average during 2006–10).
Between 2013 and 2023, the U.S. Census Bureau modified its criteria for delineating urban areas in two ways. First, housing unit density replaced population density as the primary statistic to distinguish urban and rural territory. Second, the minimum size to qualify to be an urban area changed from 2,500 people to 2,000 housing units or 5,000 people. This served to increase the rural population overall and to increase the number of counties with fewer than 5,000 urban population (codes 8 and 9). As seen in the table below, the number of counties with code 8 increased from 220 to 466 between 2013 and 2023, almost entirely as a result of this change in the urban area population threshold. Similarly, the number of counties with code 9 jumped from 424 to 589. Much lower numbers are evident in codes 6 and 7.
| Code | Number of counties 2013 | Number of counties 2023 | ||||||
|---|---|---|---|---|---|---|---|---|
| 1 | 432 | 443 | ||||||
| 2 | 379 | 385 | ||||||
| 3 | 356 | 358 | ||||||
| 4 | 214 | 201 | ||||||
| 5 | 92 | 76 | ||||||
| 6 | 593 | 379 | ||||||
| 7 | 433 | 247 | ||||||
| 8 | 220 | 466 | ||||||
| 9 | 424 | 589 | ||||||
| Source: USDA, Economic Research Service using data from the Office of Management and Budget and U.S. Department of Commerce, Bureau of the Census. | ||||||||
Data Sources
Office of Management and Budget (OMB), Metropolitan and Micropolitan Area Delineation Files, July 2023
U.S. Department of Commerce, Bureau of the Census, 2020 Census Demographic and Housing Characteristics File (DHC)
U.S. Department of Commerce, Bureau of the Census, U.S. Census Bureau, 2020 Census Island Areas Demographic and Housing Characteristics File (DHC)
U.S. Department of Commerce, Bureau of the Census, U.S. Department of Commerce, Bureau of the Census, U.S. Census Bureau, County Adjacency File 2023
U.S. Department of Commerce, Bureau of the Census, U.S. Census Bureau, County-to-County Commuting Flows: 2016–2020
U.S. Department of Commerce, Bureau of the Census, U.S. Census Bureau, Urban Area to County Relationship File 2020
Recommended Citation
U.S. Department of Agriculture, Economic Research Service. Rural-Urban Continuum Codes. January 2024.