Rural Child Poverty Chart Gallery
Note: Updates to this data product are discontinued. Over 1 in 4 rural children are living in families that are poor, according to the official poverty measure, up from 1 in 5 in 1999, but this change was uneven across the rural landscape. Counties with high vulnerability to child poverty, those with both low young adult education levels and high proportions of children in single-parent families, were generally the most hard-hit by the recession of the past decade and experienced substantial increases in their already high child poverty rates. Along with the recession, an increase in rural children in single-parent households, continuing from the 1990s, was a major contributor to the rise in child poverty after 2000. Three factors that shape the geography of high and increasing rural child poverty are explored below: economic conditions, young adult education levels, and family structure. This collection of maps complements the July 2015 Amber Waves feature, Understanding the Geography of Growth in Rural Child Poverty.

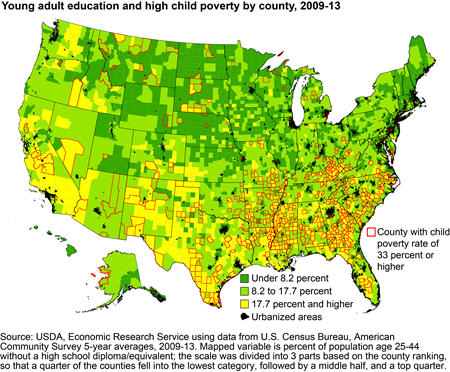
Rural education levels have been rising and this is reflected in county statistics. The top quarter of nonmetropolitan counties in young adult (ages 25-44) high school dropout rates in 2009-13 had poverty rates of nearly 18 percent or more. While high, the number of counties with rates this high had fallen from 841 in the 2000 Census to 493. The economic hardship associated with low education levels is reflected in child poverty statistics. Slightly over half of the counties with child poverty rates of over 33 percent were also counties in the top quarter in young adult high school dropout rates. At the same time there are many counties with low education levels, often with substantial Hispanic populations, including mining counties in west Texas and large scale agricultural counties in southwest Kansas, that have lower child poverty rates.

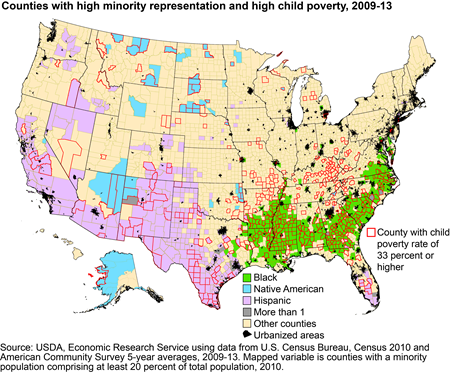
Over 1 in 4 rural (nonmetro) counties had a minority population?Black, Hispanic, or Native American?comprising at least 20 percent of the total population in 2010. The number of rural counties with over 20 percent of the population reporting themselves as Hispanic increased by a third between 2000 and 2010, to reach 210 (keeping the same 2013 definition of nonmetropolitan). Rural Native American counties also increased, from 46 to 55. However, the number of Black counties declined, from 285 to 277. Black counties were especially hard hit by the decline in manufacturing jobs in the 2000s, a decline that accelerated with the recession of 2007-09 and its aftermath. Child poverty, more dependent than poverty in general on labor market conditions, rose considerably in Black counties. The proportion of these counties with child poverty rates of 33 percent or more rose from a third in 1999 to nearly two thirds (66 percent) in 2009-13.

